When an Amazon product suddenly looks more profitable, check whether its recorded inventory batches still cover the units sold. If some sales have no recorded batch left to supply their purchase cost, the cost used for those units can make reported profit look better than the underlying economics. That matters before you use the higher figure to justify a lower price or more advertising spend.
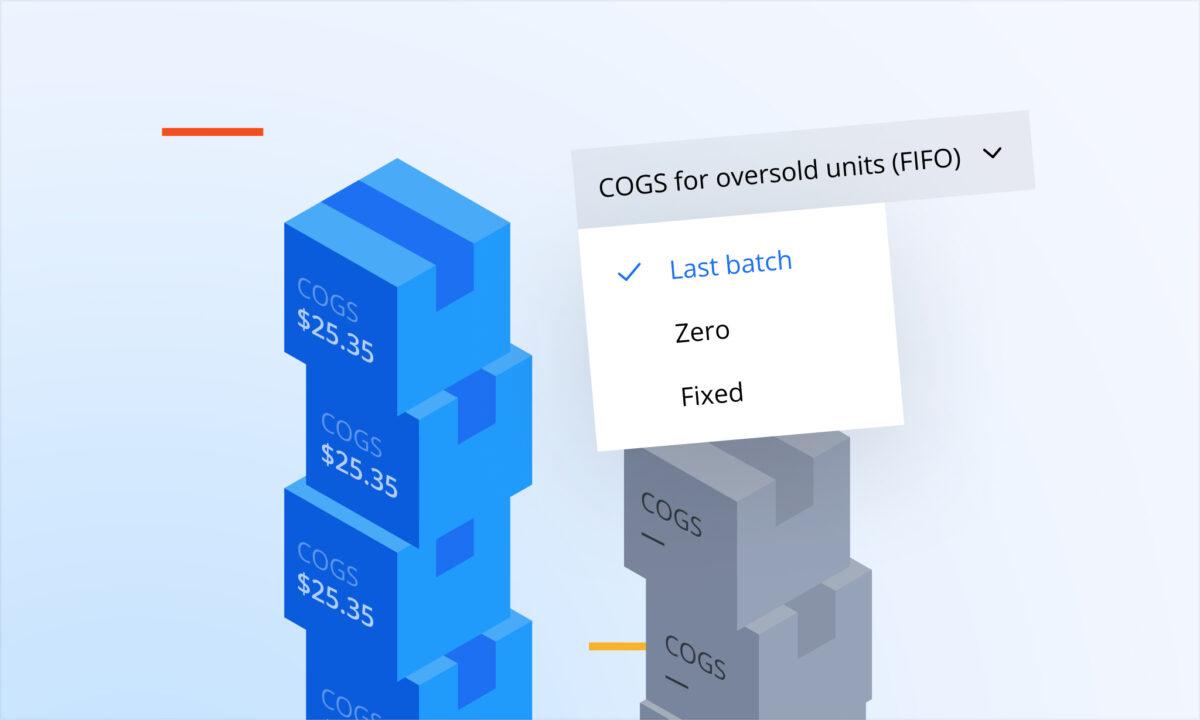
For products using FIFO in sellerboard, there is a specific setting for this situation: “COGS for oversold units (FIFO)”. Understanding that setting, then checking the actual batch records, helps you distinguish a real improvement from a gap in cost data.
What happens when sales outpace recorded batches
COGS means cost of goods sold: the inventory cost assigned to the units you sell. FIFO means first in, first out. It assigns the cost of the earliest inventory batch to sales first, then moves through later batches as the recorded quantities are used up.
That process depends on having the relevant batch quantities and costs in the system. Imagine that you received a new shipment and continued selling, but its batch record has not yet been added. Your physical stock and your cost records are now telling different stories.
In this context, “oversold” describes sales beyond the quantities covered by the recorded FIFO batches. It does not by itself mean that you accepted orders without physical inventory. The gap may be in the records, so check the product’s receipts and batch entries before drawing a conclusion about stock availability.
Once recorded batch coverage runs out, sellerboard uses the selected treatment for those oversold units. The default is “Last batch”, which uses the last batch’s cost. “Zero” and “Fixed” are other available choices. Missing a batch therefore does not automatically mean that the units receive a zero cost.
How much can a missing cost change the result
Consider a simplified, hypothetical example. A seller has recorded 100 units at $8 each and has sold 150 units. A further shipment was received but has not been entered, leaving 50 sold units beyond the recorded batch coverage. The actual inventory cost of each of those 50 units is also $8.
For each affected unit, assume $30 in sales and $12 in all other costs combined, including Amazon fees and advertising. Hold the selling price, these other costs and everything else constant. Compare including the actual $8 cost with assigning $0 because the “Zero” option was selected. These figures are illustrative, not a sellerboard customer result.
| For the 50 affected units | With the actual unit cost | With Zero selected |
|---|---|---|
| Sales per unit | $30 | $30 |
| Other costs per unit | $12 | $12 |
| COGS per unit | $8 | $0 |
| Profit per unit in this example | $30 − $12 − $8 = $10 | $30 − $12 − $0 = $18 |
| Profit across the 50 units | $500 | $900 |
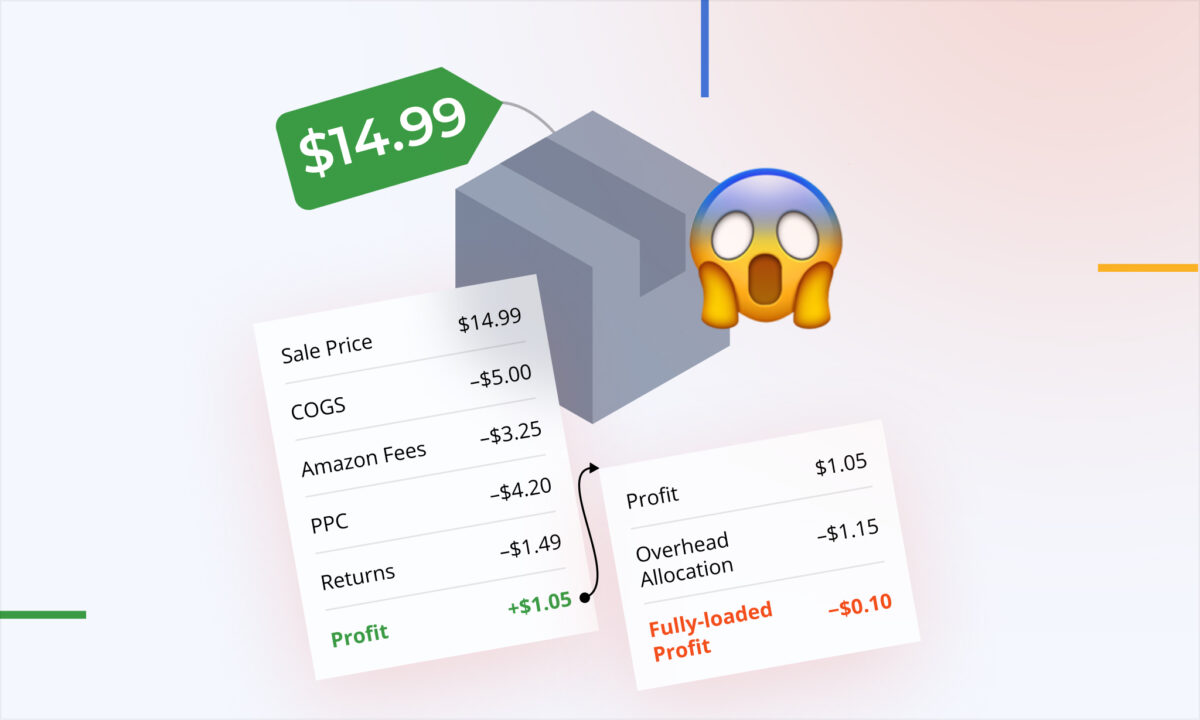
The difference is $8 per unit, or 50 × $8 = $400. The extra $400 shown in the zero-cost version comes entirely from omitted inventory cost. The seller has not earned an additional $400 from these sales.
An outdated nonzero cost can also overstate the result. If the last recorded batch cost $6 but those 50 units actually cost $8 each, using $6 would leave a $2 gap per unit. With the same assumptions, reported profit would be $100 too high: 50 × ($8 − $6). The issue is the difference between the cost used and the cost that belongs to the units.
What should you check before acting on the increase
Start with the product, marketplace and dates behind the apparent improvement. Keep that scope fixed while you compare sales, COGS and profit. A higher account total may have several causes, so isolate the product whose unit economics appear to have changed.
Open the product’s COGS entry in Products and review the batches. Check the receipt dates, quantities and unit costs against your actual records. Look for an unentered shipment, an understated quantity or a cost that no longer matches the relevant batch. If you track different marketplace costs, check the appropriate marketplace tab.
Then review the treatment for sales beyond those quantities. Which setting is selected? If it is “Last batch”, what cost does that last batch contain? If it is “Fixed”, what default value has been entered for this product? If it is “Zero”, remember that the affected units carry no inventory cost in that calculation.
Correct missing or incorrect batch entries using the actual receipt date, quantity and cost. A default value supplies a cost assumption for uncovered sales; it does not supply the missing shipment record. Keep track of both tasks so that setting a plausible value does not leave the underlying data gap forgotten.
How do the three options work in sellerboard
Go to Settings > Calculation logic and find “COGS for oversold units (FIFO)”. This controls the cost treatment for units sold beyond recorded FIFO batch coverage.
- Last batch uses the cost of the last batch. This is the default behavior. Check the value when supplier or shipment costs have changed.
- Zero assigns a cost of zero to the oversold units. Read profit with that choice in mind; a zero value in the report does not establish that the inventory was free.
- Fixed lets you set a default COGS value for each product. The value needs to be entered for the relevant products and reviewed when the cost assumption changes.
When “Fixed” is selected, go to Products and open the product’s COGS entry pop-up. Click “Default COGS” next to “Add new period”, then enter the default value for that product. Changing a product’s default COGS value triggers recalculation.
After updating the records or default value, review the relevant dates and product again. Check the cost now reflected in the result rather than assuming that an improved-looking number means the data is complete. Keep the same filters so you can understand the effect of the update.
Read the sellerboard guide to managing product costs
What should change in your next decision
If missing or understated COGS explains the profit jump, use the corrected cost picture when you revisit the decision that prompted the check. In the example, the affected sales leave $10 per unit after the stated costs, so the $18 figure would overstate the amount available before any additional spending.
If the increase remains after the cost review, continue investigating what changed in prices, fees, advertising or the products sold. Complete batch records make that analysis more useful, but they do not establish the cause of every profit movement. The aim is to make the decision with the relevant costs included.
Common mistakes
- Treating an unexpected profit increase as evidence of better performance before checking COGS.
- Assuming missing FIFO batches always produce zero COGS. Last batch is the default treatment.
- Reading “oversold” as proof of a physical stockout without checking the inventory records.
- Entering a fixed value and leaving the missing batch quantity or receipt uncorrected.
- Changing cost settings to make profit look higher instead of checking whether the cost data is complete.
FAQ
Does an oversold FIFO batch mean I sold stock I did not have?
It means sales exceeded the quantities covered by the recorded FIFO batches. Physical stock may have been available while a receipt or quantity was missing from the cost records. Check both before deciding what happened.
Does sellerboard use zero when recorded batches run out?
The “Zero” option assigns zero COGS, but the default treatment is “Last batch”. “Fixed” is also available, with a default COGS value entered per product. Check both the selected option and the cost value behind it.
Can a fixed default replace maintaining batch records?
It provides a chosen cost for oversold units, but it does not add the missing batch’s date or quantity. Record the actual batches and review the default value as a separate part of the cost setup.
Will changing the setting create more profit?
It changes the cost used in the calculation. The underlying purchase cost remains real. In the example above, omitting $400 of inventory cost raises the reported result by $400 without improving the economics of the sales.
Before trusting a sudden profit jump, check which cost was assigned to the units sold. A lower result after correcting missing costs can give you a stronger basis for the next pricing or advertising decision.