Most reorder decisions on Amazon are ranked by a single number: how fast a SKU sells. Days of cover, sell-through rate, units per day — the entire replenishment workflow tends to orbit velocity. But the SKU that moves the most units is frequently not the one that earns the most, ties up the least cash, or deserves the biggest slice of your next purchase order. Ranking reorders by unit velocity optimizes for throughput; ranking them by profit velocity — units sold multiplied by true net profit per unit — optimizes for the thing you actually keep. The two rankings disagree more often than most sellers expect, and the gap widens once you account for the capital locked in each SKU and the storage and aging fees Amazon charges to hold it.
Why does the fastest-selling SKU usually get restocked first — and why is that the wrong default?
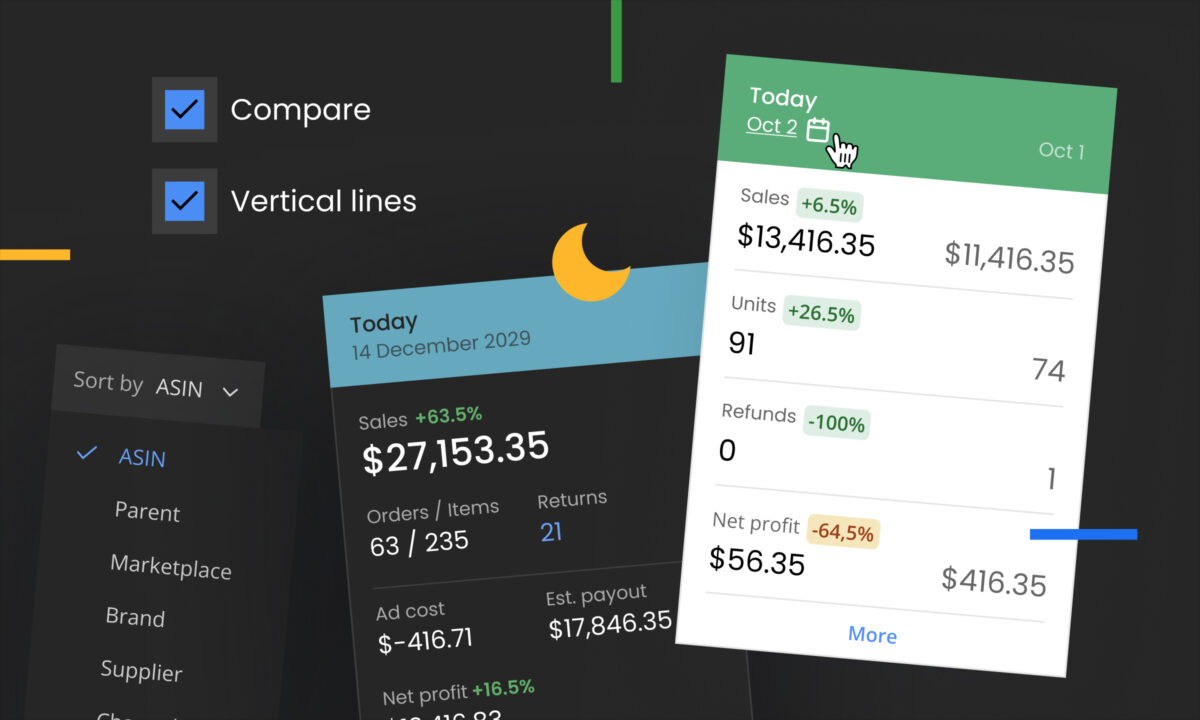
Velocity is easy to see. Every dashboard, every inventory report, every reorder alert surfaces units-per-day first, so it becomes the default sort key almost by accident. The problem is that velocity answers the question “what leaves the warehouse fastest?” — not “what should I put my reorder cash into?” Those are different questions with different answers.
A pure velocity ranking has three blind spots. It ignores how much margin survives on each unit after Amazon’s deductions. It ignores how much cash each SKU locks up per day of cover. And it ignores the asymmetric cost of holding — the storage and aging fees that turn a thin-margin fast mover into a break-even (or losing) line if demand softens. Correct any one of those and the ranking can flip. Correct all three and it flips regularly.
What is profit velocity, and how do you calculate it?
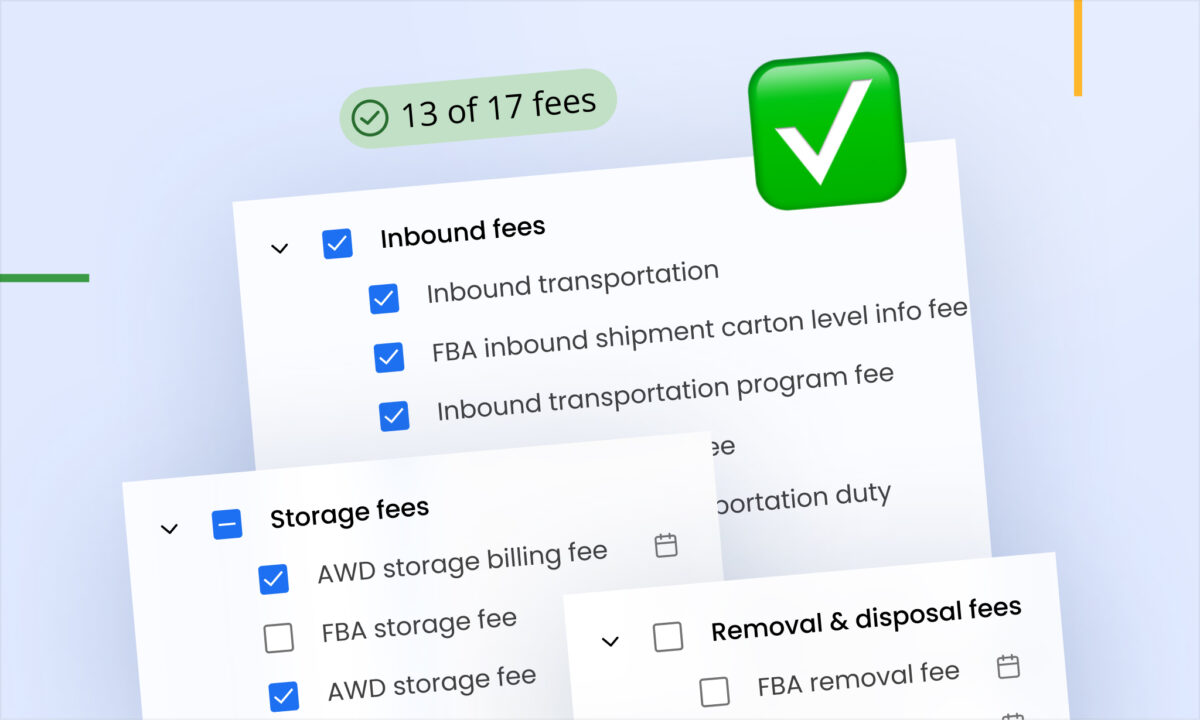
Profit velocity is units sold over a fixed window multiplied by true net profit per unit — not gross margin. True net profit is revenue minus the referral fee, fulfillment fee, PPC spend, returns, and an allocated share of storage. That distinction matters: a SKU can look healthy on gross margin and still contribute almost nothing once PPC and fees are loaded in. The multiplier is the number most sellers don’t actually have in front of them when they size a PO; a profit-analytics platform such as sellerboard computes per-SKU net profit after those deductions alongside units sold, which is what turns profit velocity from a whiteboard concept into a column you can sort your reorder list by.
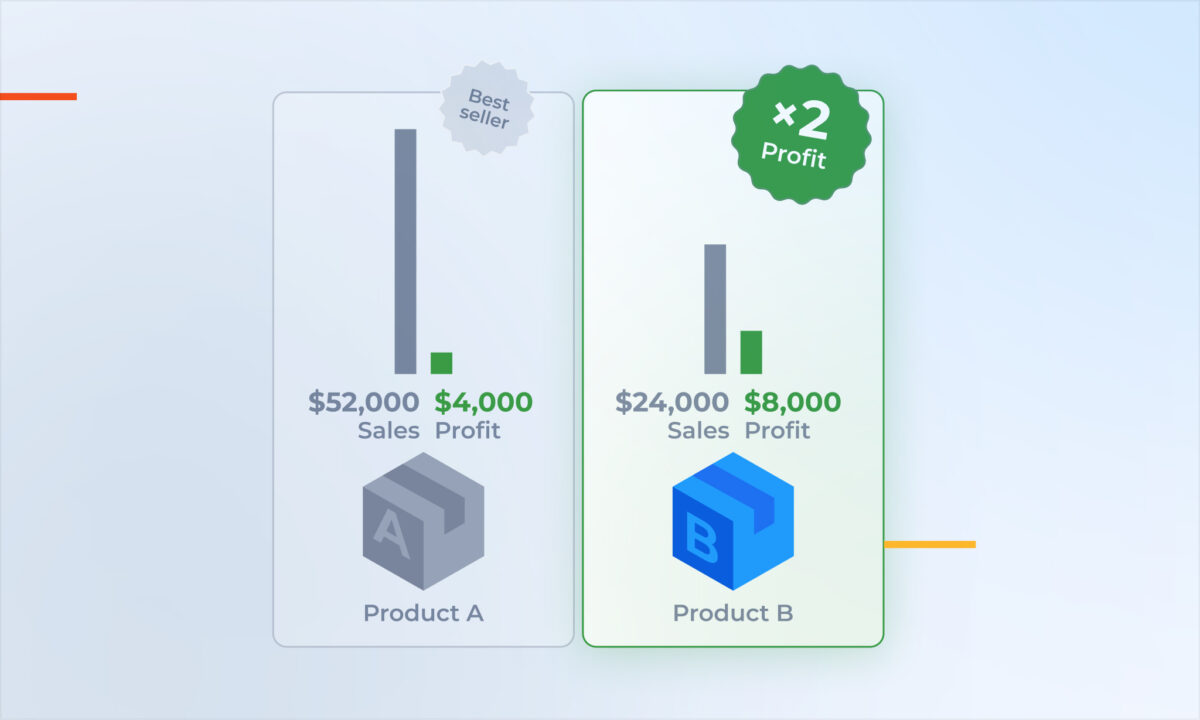
Here’s the simplest version of the reversal, using round numbers. Product A is a thin-margin high-volume SKU; Product B is a premium, slower-moving one:
| SKU | Units/day | Net profit/unit | Daily profit | Unit-velocity rank | Profit-velocity rank |
| A | 100 | $2.00 | $200 | 1 | 2 |
| B | 30 | $8.00 | $240 | 2 | 1 |
Product A sells more than three times as many units, so it wins the velocity ranking easily. But Product B earns more per day. If your reorder logic prioritizes A because it “moves faster,” you’re funneling cash toward the SKU that generates less profit per day — before you’ve even looked at how much capital each one consumes.
Note the guardrail this framing builds in: profit velocity is not raw net profit per unit. A SKU with an $8 margin that sells once a week has almost no profit velocity. Velocity stays in the equation — we’re only changing the numerator from units to net-profit dollars.
How does the cash tied up in inventory change the ranking?
Reorder cash is finite. Every dollar committed to one SKU’s stock is a dollar unavailable for another, so the honest comparison isn’t just daily profit — it’s return on the capital each SKU locks up. Layer landed cost and a target 30 days of cover onto the same two products:
| SKU | Landed cost/unit | 30-day cover (units) | Cash tied up | Monthly net profit | Return on inventory cash |
| A | $12 | 3,000 | $36,000 | $6,000 | 16.7% |
| B | $20 | 900 | $18,000 | $7,200 | 40.0% |
Product B earns more profit while tying up half the cash — a 40% monthly return on inventory investment against A’s 16.7%. This is the gross-margin-return-on-investment (GMROI) lens: the fastest mover is often the least efficient use of a reorder dollar, because high velocity at a thin margin demands a large, expensive stock position to keep in cover. Rank a reorder list by return on inventory cash and capital-heavy, thin-margin volume drops down the list where it belongs.
Why does running out of a high-profit SKU cost more than the lost units suggest?
Stockout math is where velocity-first thinking does its quietest damage. Buffer stock and safety-stock rules are usually sized in units — but a stockout doesn’t cost you units, it costs you the profit those units would have carried. Running dry on Product B (the $8 SKU) costs $240 a day in lost contribution; running dry on Product A costs $200. The higher-margin SKU is the more expensive one to run out of even though it sells fewer units, so it should carry the more conservative buffer — the opposite of what a velocity-weighted safety-stock rule produces.
The practical correction is to weight safety stock by profit contribution, not unit throughput. A one-day stockout on your highest profit-velocity SKUs is a bigger event than a one-day stockout on your fastest sellers, and reorder points should reflect that asymmetry.
How do storage and aging fees quietly flip a velocity ranking?
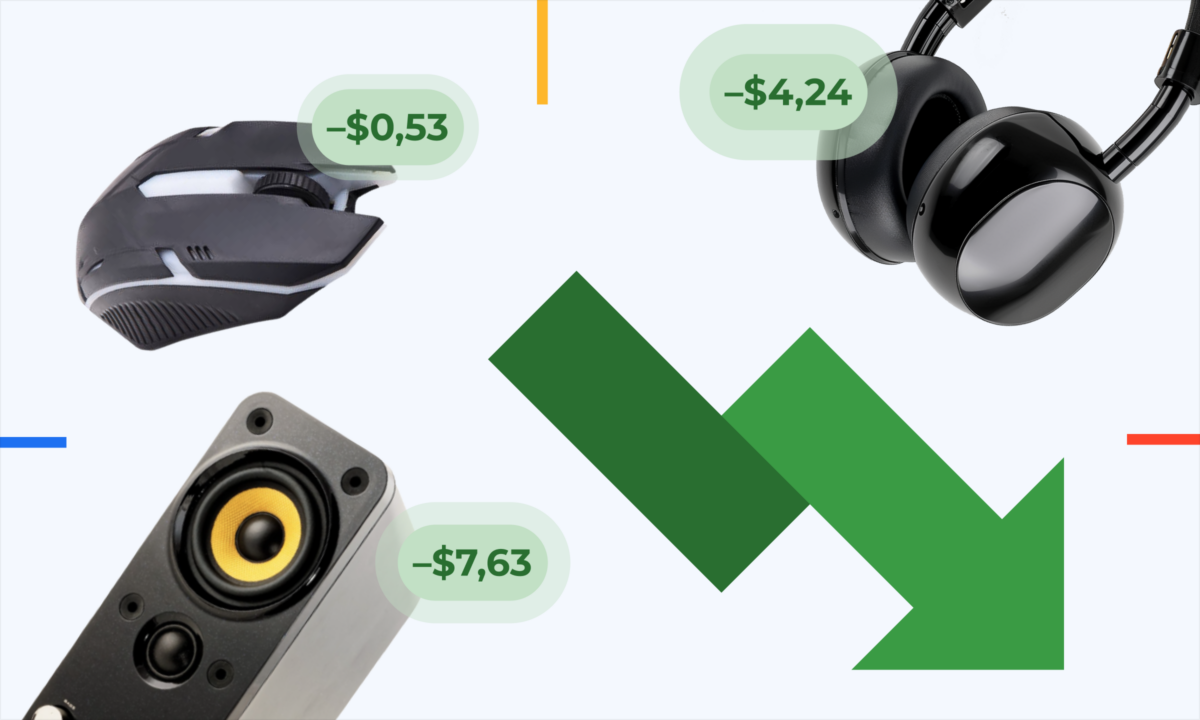
Storage is the mechanism that turns a thin-margin fast mover from “fine” into “why is this SKU losing money?” Per Amazon’s 2026 US fee schedule, monthly storage for standard-size inventory runs $0.78 per cubic foot from January through September and jumps to $2.40 per cubic foot in Q4 (October–December) — roughly triple. Apply that to the two SKUs, assuming Product A occupies 0.19 cu ft per unit and Product B 0.50 cu ft:
| SKU | Unit cube | Units held | Off-peak storage/mo | Q4 storage/mo | Storage as % of monthly profit (off-peak → Q4) |
| A | 0.19 cu ft | 3,000 | $444.60 | $1,368.00 | 7.4% → 22.8% |
| B | 0.50 cu ft | 900 | $351.00 | $1,080.00 | 4.9% → 15.0% |
Product A holds far more units, so despite its smaller unit cube it carries the heavier storage load — and in Q4, storage alone eats nearly a quarter of its profit. The premium SKU, even with a larger per-unit footprint, gives up a smaller share of a bigger margin.
Then there’s aging. Amazon’s 2026 aged-inventory surcharge begins at 181 days in a fulfillment center — earlier than the 271-to-365-day trigger of the retired long-term storage fee, and a point many reorder models haven’t updated for. It stacks on top of the monthly storage fee, escalates in steps the longer a unit sits, and reaches roughly $6.90 per cubic foot (or a per-unit rate, whichever is greater) past a year. On Product A’s 570 cubic feet, a top-tier aged surcharge would layer on the order of $3,900 a month on top of base storage — more than enough to erase the SKU’s entire contribution.
That is the downside a velocity ranking never sees. It over-orders the thin-margin mover, and if demand softens even slightly, the aging clock does the rest. (Amazon adjusts the surcharge tiers periodically, so verify the live rates in your Seller Central fee schedule when you model a specific SKU.)
When should a slower-selling product get reorder priority — and how do you operationalize it?
Prioritize a slower SKU whenever its profit velocity or its return on inventory cash is higher than the faster one’s — which, as the tables above show, is a routine outcome, not an edge case. The operational change is small: keep pulling units-sold data, but add two columns to your reorder view.
- Profit velocity = true net profit per unit × units sold over your reorder window (7, 14, or 30 days). Sort the reorder list by this instead of by units.
- Return on inventory cash = periodic net profit ÷ cash tied up in that SKU’s stock. Use it to break ties and to demote capital-heavy, thin-margin volume.
Then weight safety stock by profit contribution rather than units, and treat the 181-day aging line as a hard planning constraint — size POs so units clear well before they cross it, especially anything you’re stocking up for Q4, when storage rates triple and any over-order sits through the most expensive months of the year.
The one-line version: velocity tells you what’s leaving. Profit velocity, adjusted for the capital it consumes and the fees it accrues, tells you what to buy again.
FAQ
Does this mean sales velocity no longer matters? No. Profit velocity is built from velocity — it’s units sold multiplied by net profit per unit. A high margin on a SKU that barely sells produces almost no profit velocity, which is exactly why raw per-unit profit is also the wrong ranking. The argument is narrow: keep velocity in the calculation, but change the numerator from units to net-profit dollars.
How do I calculate profit velocity for a SKU? Multiply the SKU’s true net profit per unit (after referral, fulfillment, PPC, returns, and storage) by units sold over a fixed window — 7, 14, or 30 days — and rank your reorder list by that figure rather than by units sold. For a capital view, divide each SKU’s periodic net profit by the cash tied up in its inventory to get a return-on-inventory number.
Should a slow-moving product ever get reorder priority over a fast one? Yes — when its profit velocity or its return on inventory cash is higher. A SKU selling a third as many units can out-earn a fast mover while tying up half the capital, as the worked example above shows. The reverse holds too: some fast movers deserve less stock than their velocity implies once fees and capital are loaded in.
Where does Amazon’s aged-inventory surcharge start in 2026? Amazon’s 2026 aged-inventory surcharge begins at 181 days in a fulfillment center, replacing the older long-term storage fee that triggered at 271–365 days. It’s charged on top of monthly storage, escalates the longer a unit sits, and reaches roughly $6.90 per cubic foot (or a per-unit rate, whichever is greater) past a year. Exact tier rates are published in your Seller Central fee schedule and Amazon adjusts them, so verify against the live schedule when you model.
What return on inventory investment should I aim for? There’s no universal benchmark — it varies by category, price band, and turn rate. The useful move is relative, not absolute: rank your own SKUs by return on inventory cash and make the low-return, capital-heavy ones justify their slice of the next PO, rather than defaulting to whoever sold the most units.