For Amazon sellers, growth in 2026 isn’t about doing more tasks, launching more campaigns, or constantly chasing new strategies.
The businesses scaling successfully right now are usually doing something simpler: they’re identifying what already works and improving it consistently.
Instead of spreading attention everywhere, the focus is shifting toward optimization, efficiency, and better decision-making.
Here are four areas that can have the biggest impact on sustainable Amazon growth.
1. Let Performance Data Guide Your Next Move
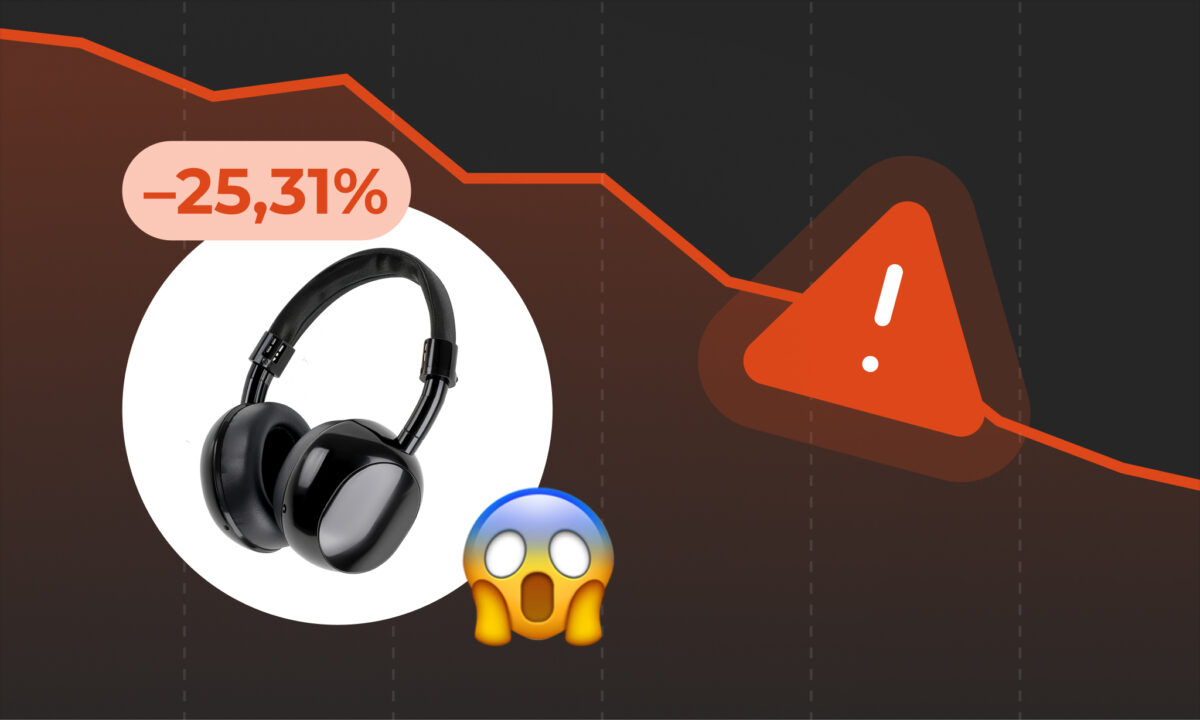
One of the most common mistakes sellers make is trying to solve the wrong problem.
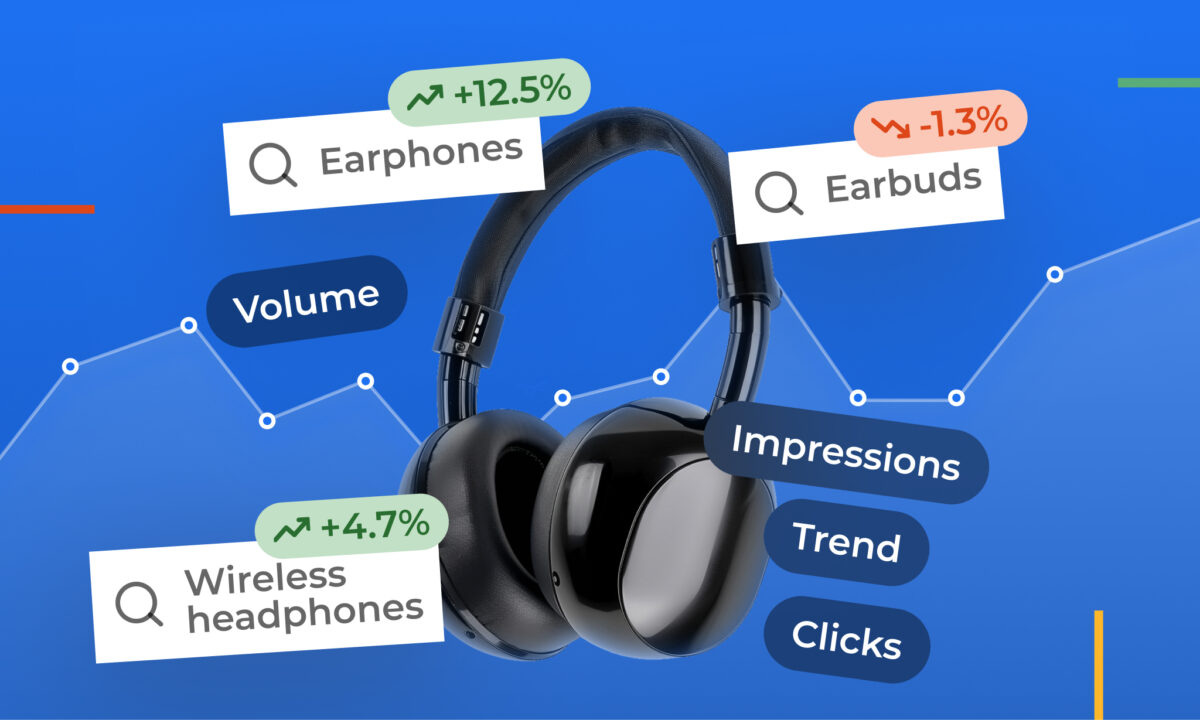
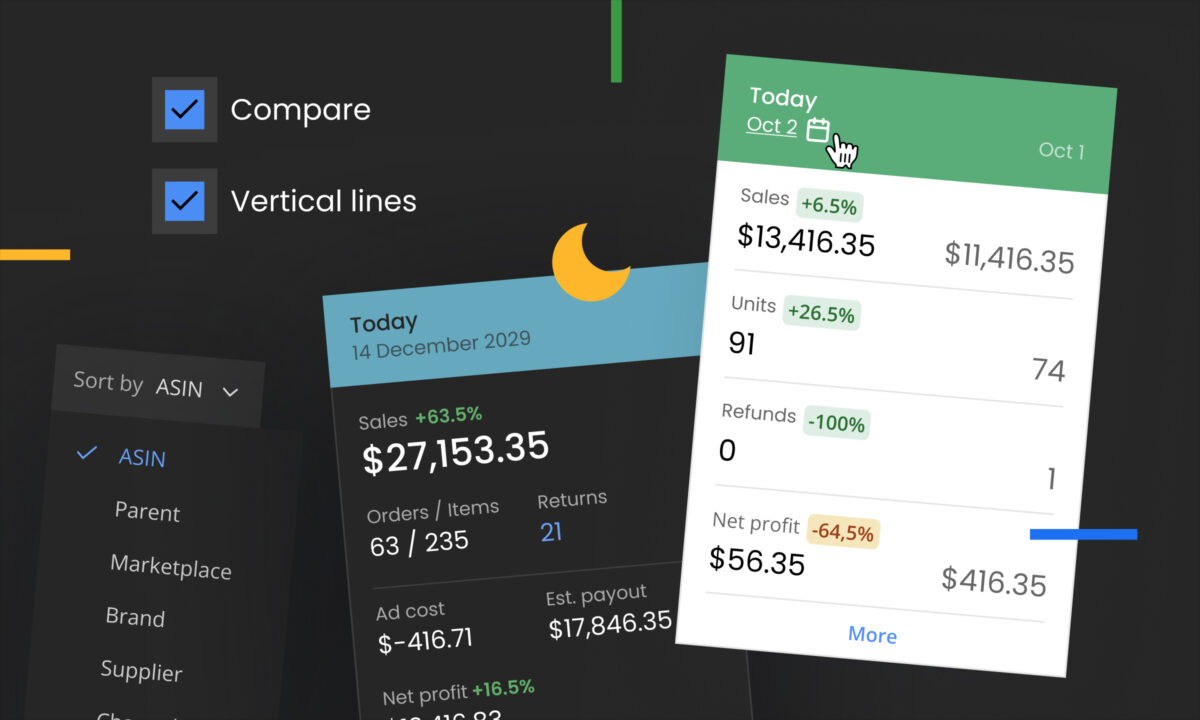
Before making changes, start with the signals your data is already giving you.
For example:
- High traffic + low add-to-cart rate usually points to a conversion issue
- Strong click-through rate + weak sales can indicate poor listing communication
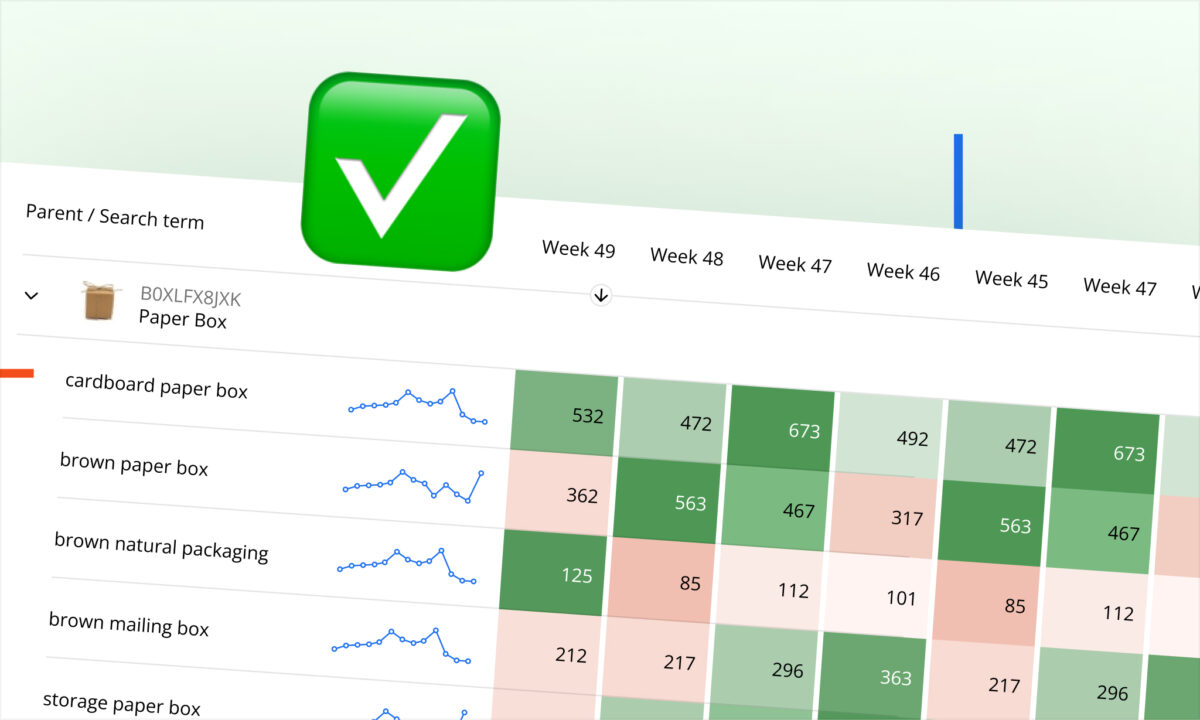
- Low impressions may suggest keyword or visibility problems
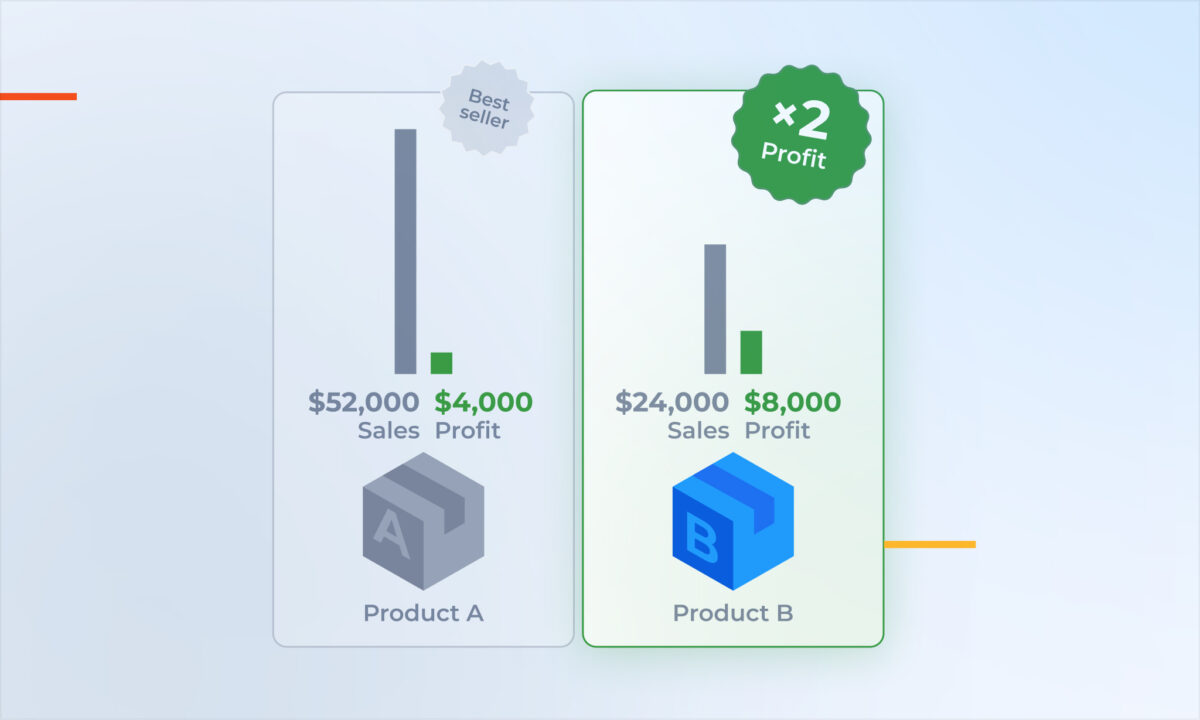
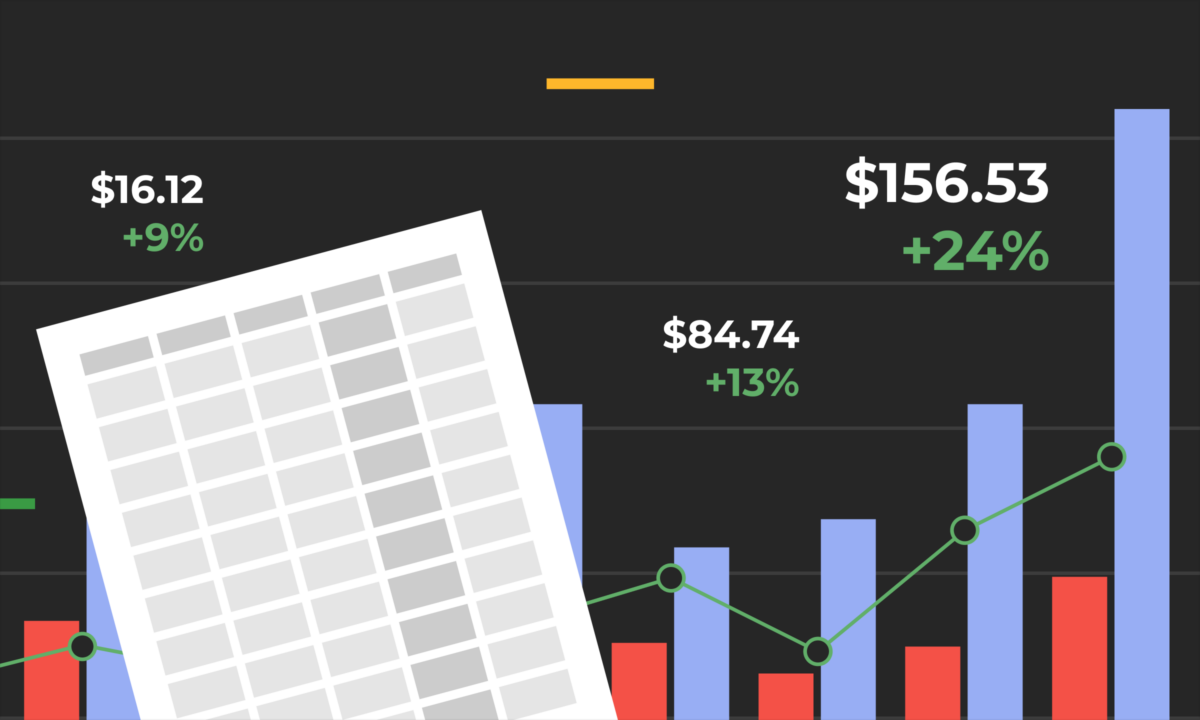
This approach helps you prioritize actions based on impact instead of assumptions.
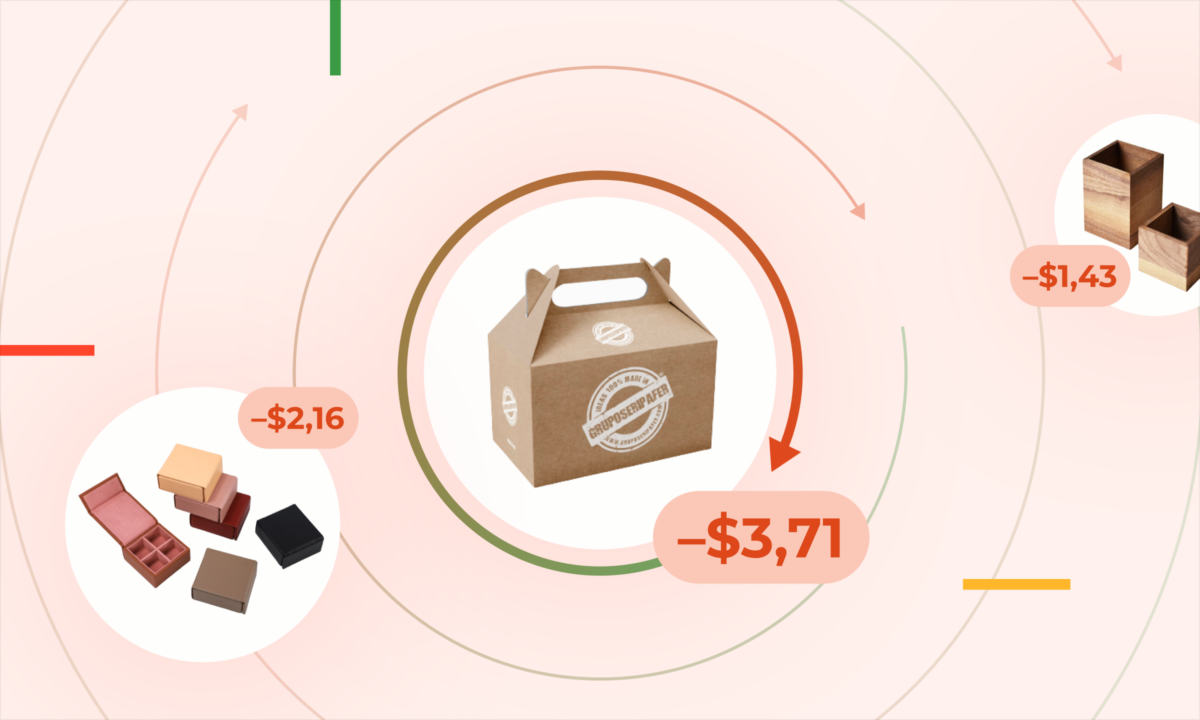
In many cases, small listing improvements can create measurable results:
- refining the hero image
- improving the first A+ module
- clarifying product benefits
- simplifying messaging
Incremental improvements compound over time, especially across multiple ASINs.
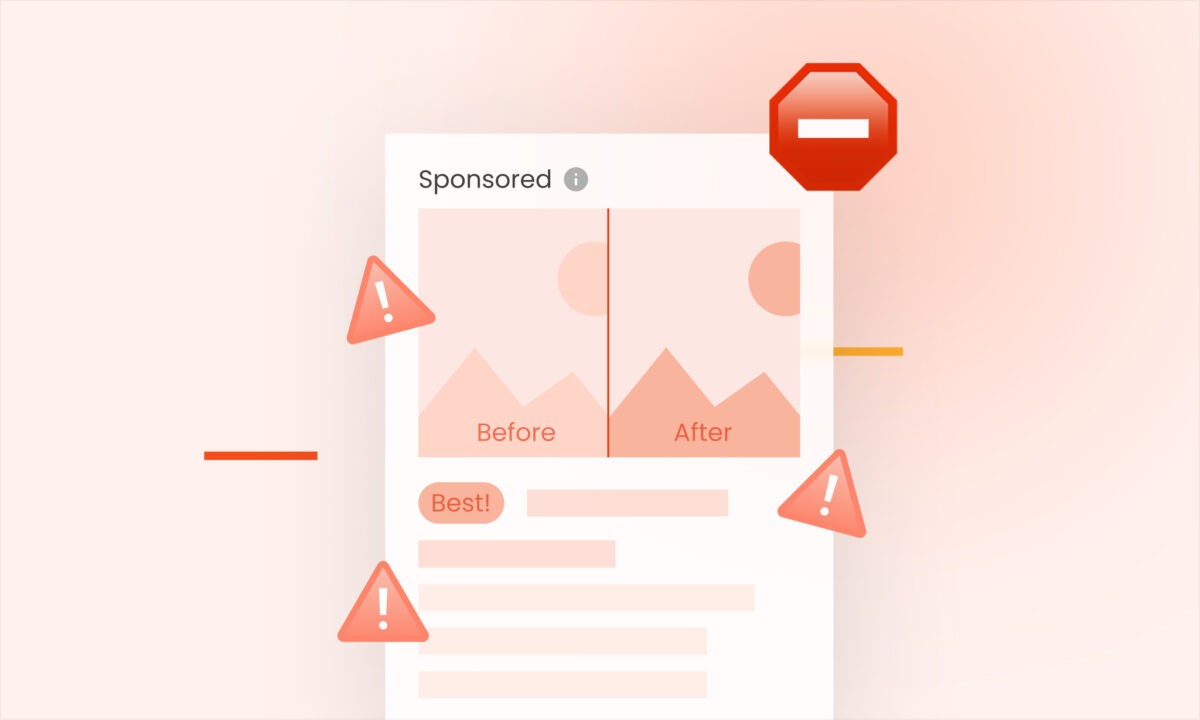
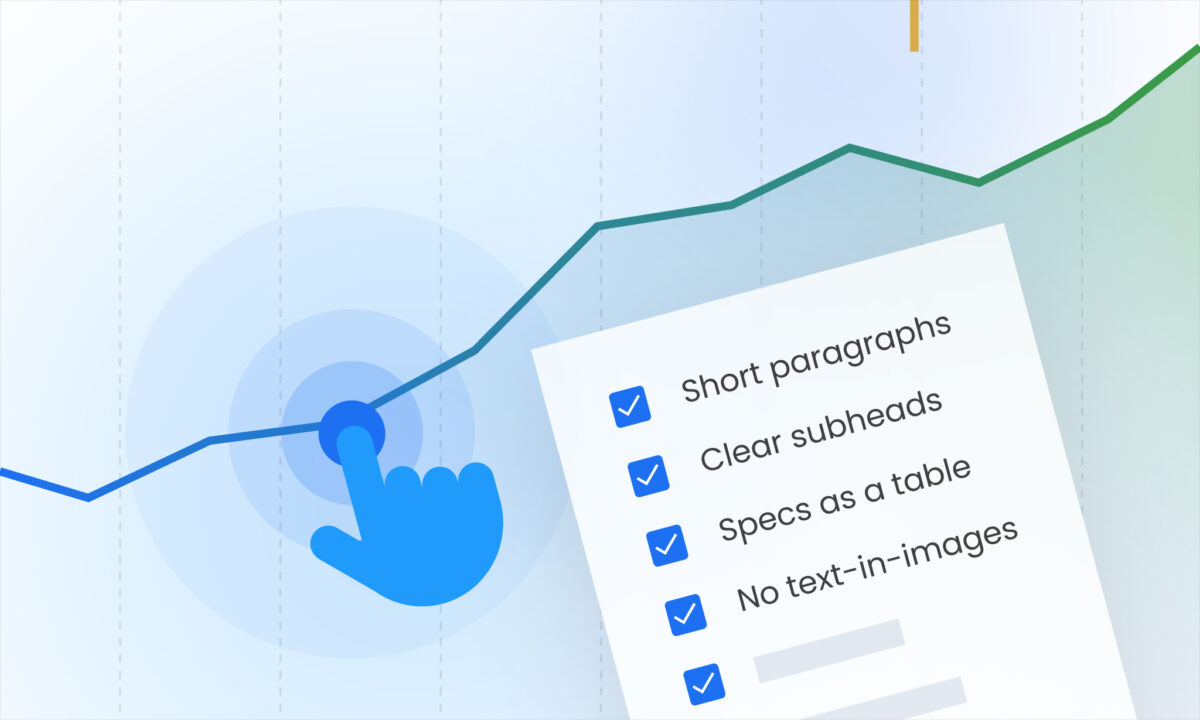
2. Make Your Amazon Store Easier to Shop
A visually attractive Store is helpful, but usability matters more.
Many Stores lose potential buyers simply because shoppers struggle to find the right products quickly.
Improving navigation often has a direct effect on conversion rates.
Some practical optimizations include:
- creating a clearer category structure
- reducing the number of clicks to bestselling products
- highlighting key product benefits earlier
- improving mobile browsing experience
- simplifying Store layouts
The easier it is for customers to move through your Store, the more likely they are to purchase.
Good Store design isn’t about adding more sections — it’s about reducing friction.
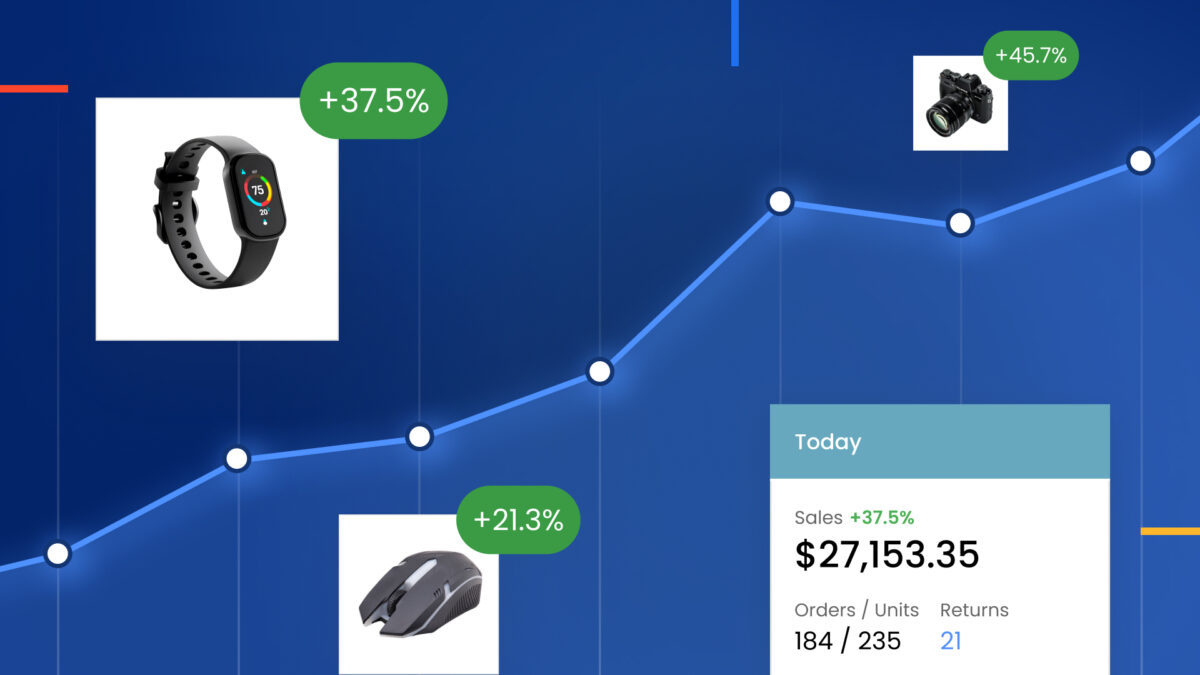
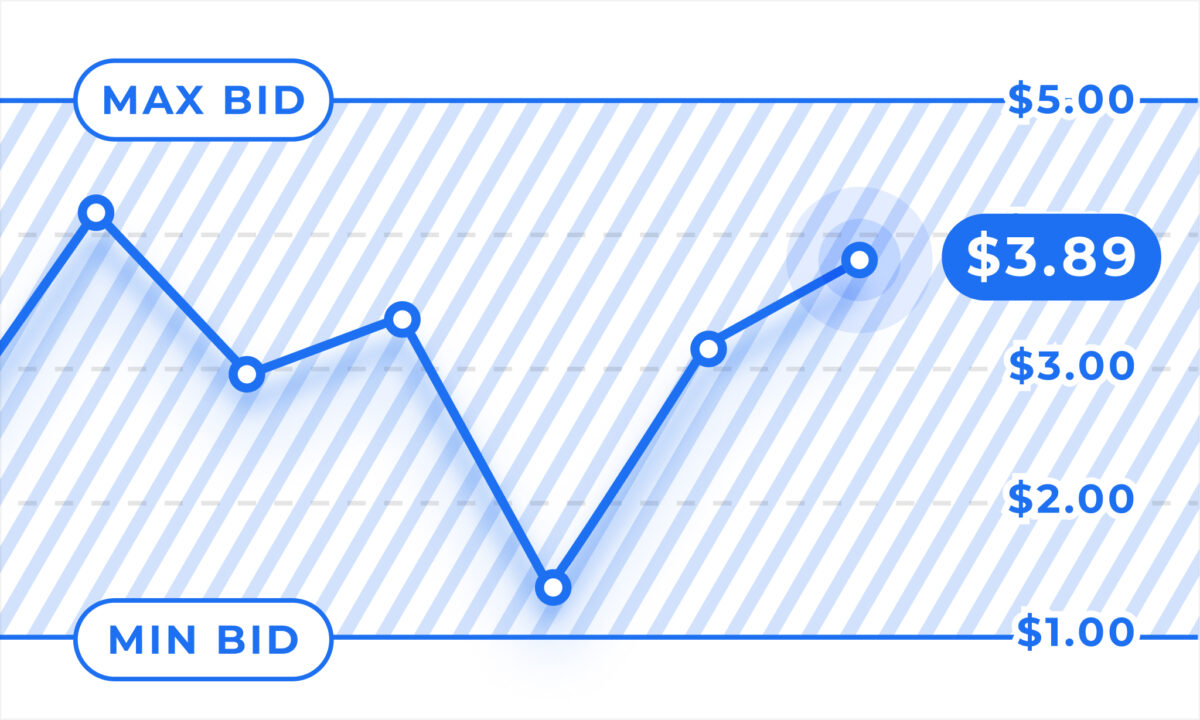
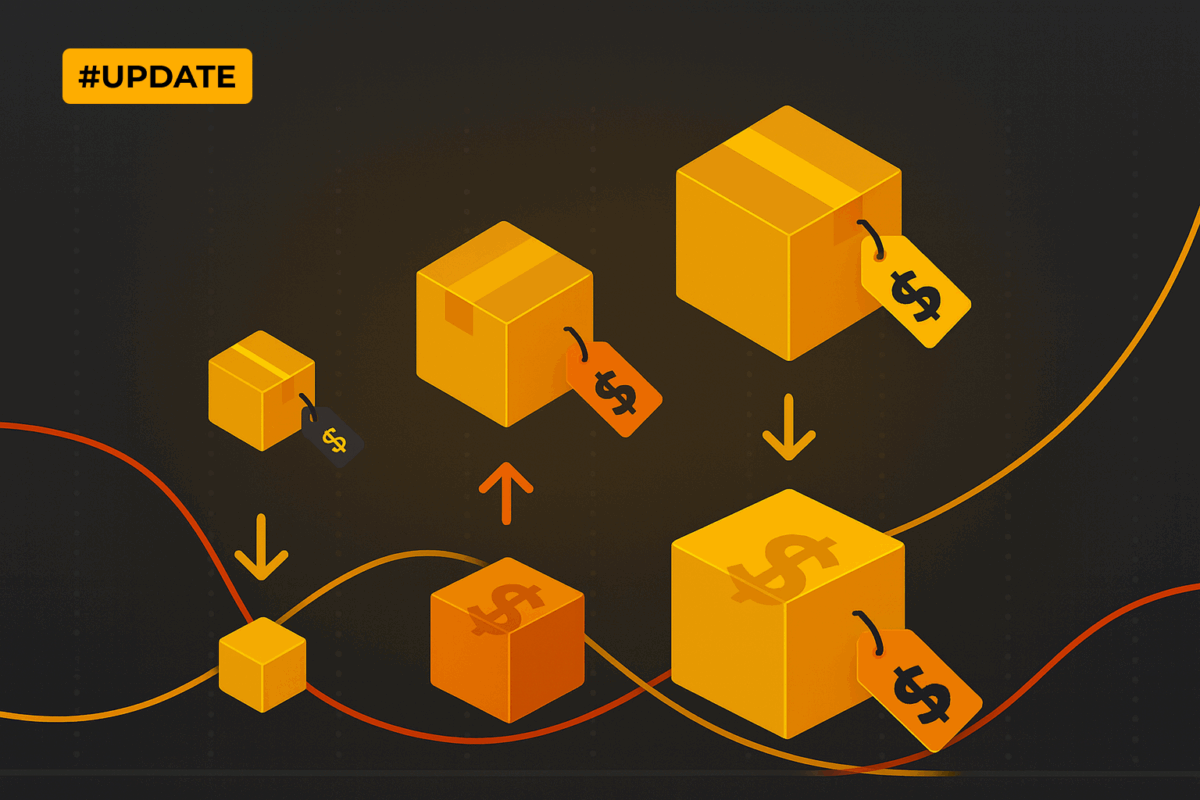
3. Scale Advertising by Expanding Proven Winners
Sustainable ad growth rarely comes from launching dozens of new experiments at once.
Instead, strong Amazon advertisers scale by expanding strategies that already show positive signals.
A common example:
- identify a high-performing product
- expand it into Sponsored Brands campaigns
- target the same high-intent keywords or audiences
- monitor performance closely before increasing spend further
The goal is controlled scaling, not aggressive scaling.
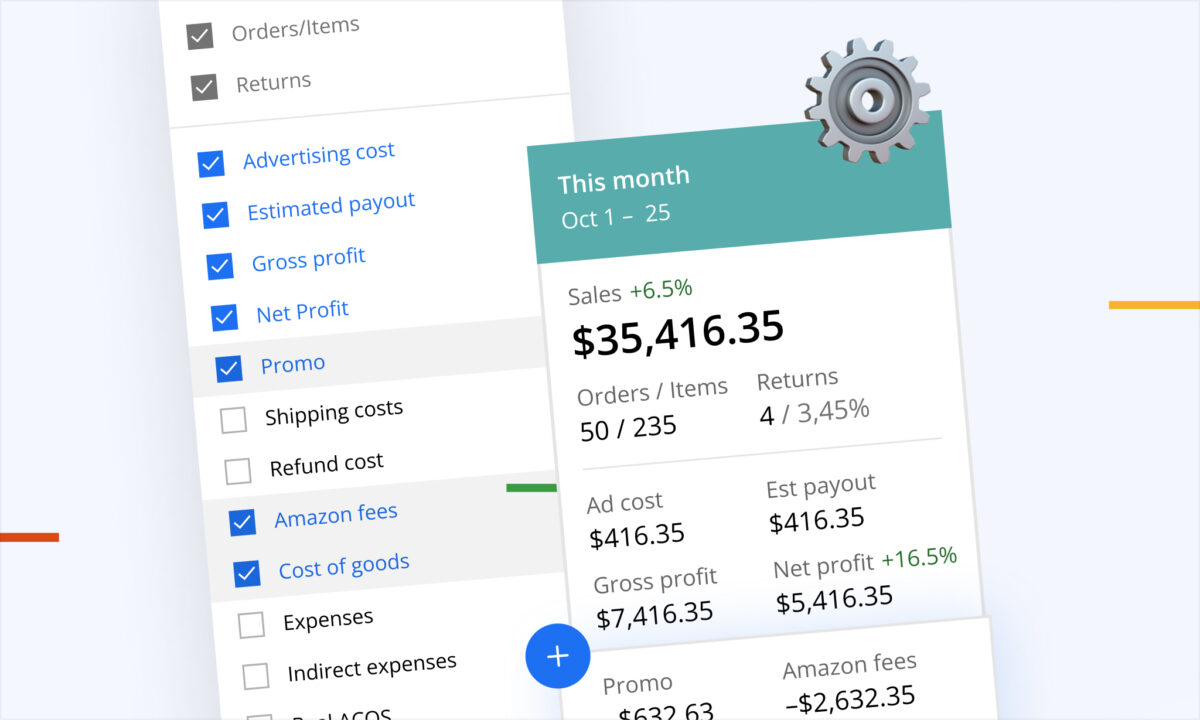
It’s also important to track profitability metrics carefully. Higher spend alone doesn’t equal growth if advertising costs are rising faster than revenue.
Focus on:
- ACOS
- TACOS
- conversion rate
- profitability by campaign
Successful scaling is usually gradual, measurable, and repeatable.
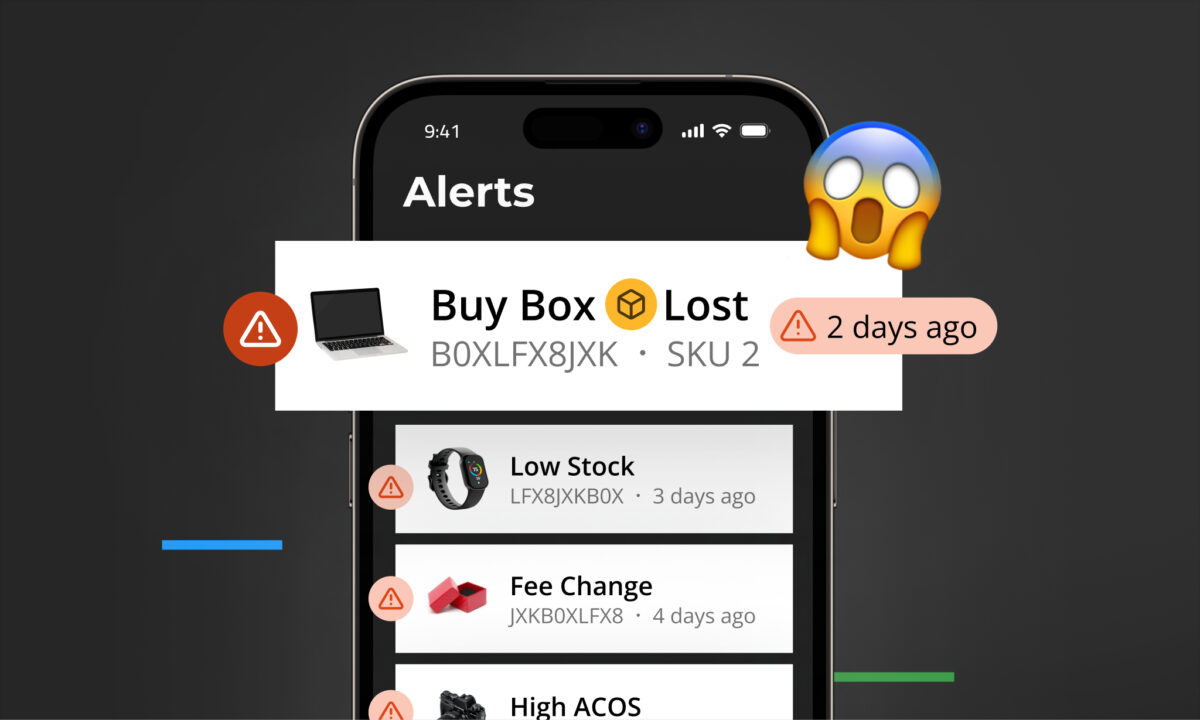
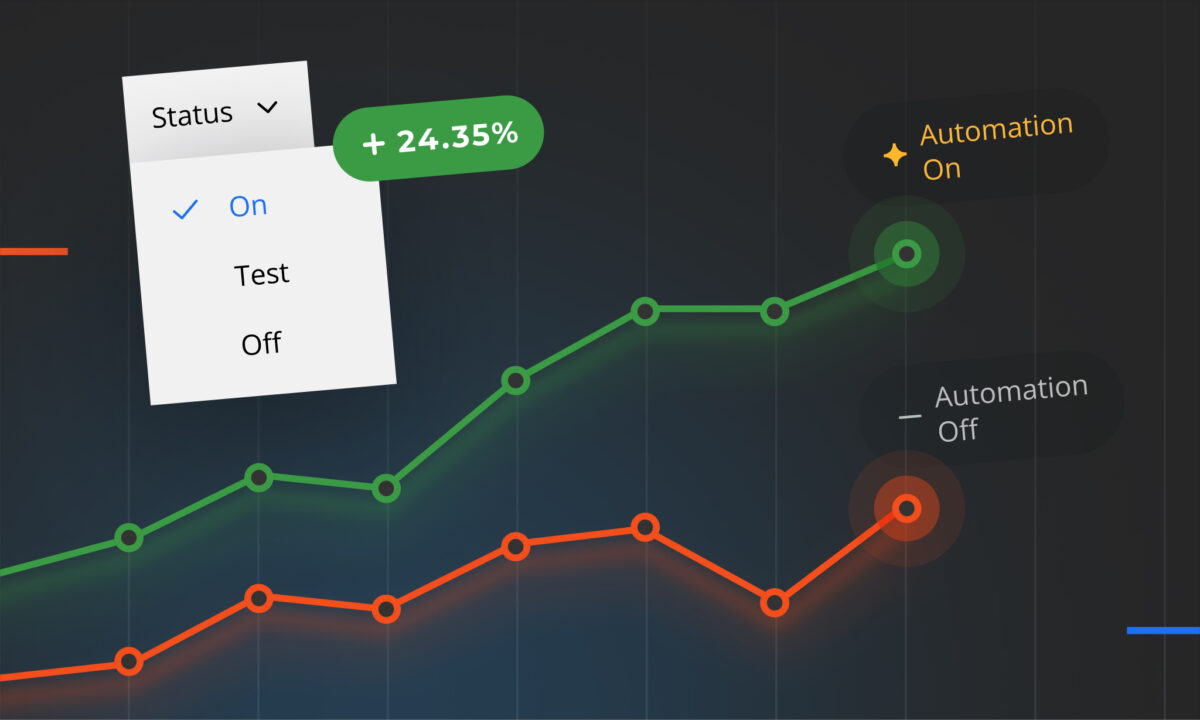
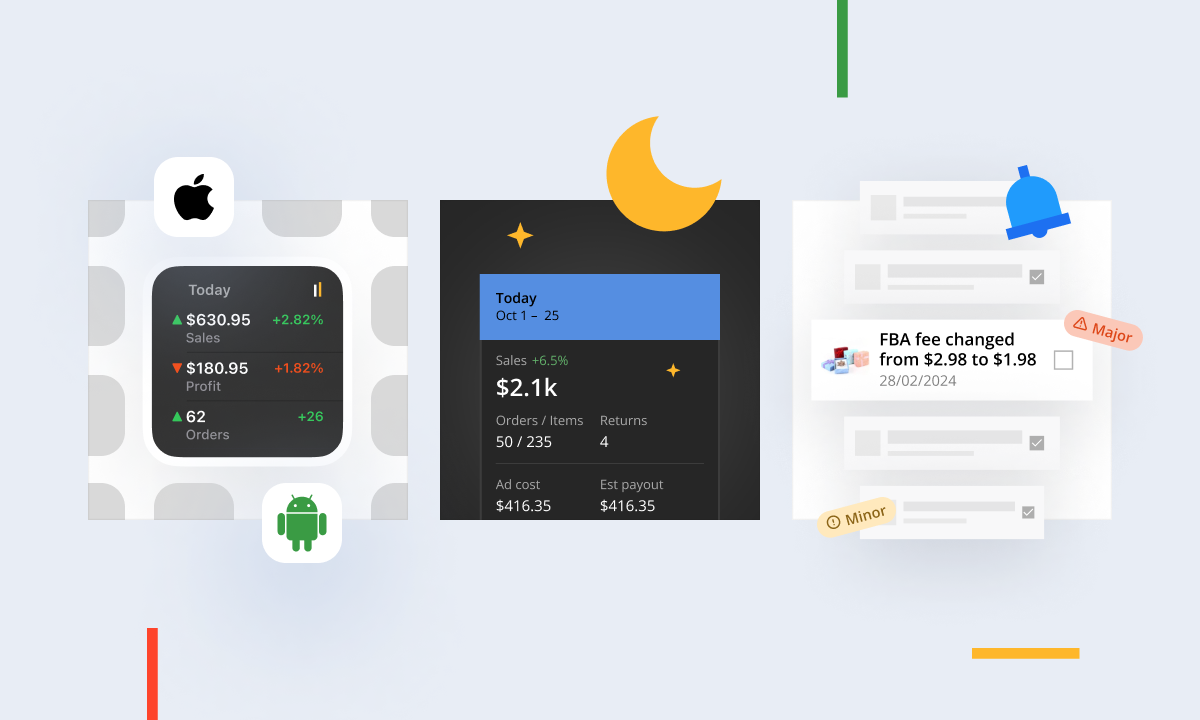
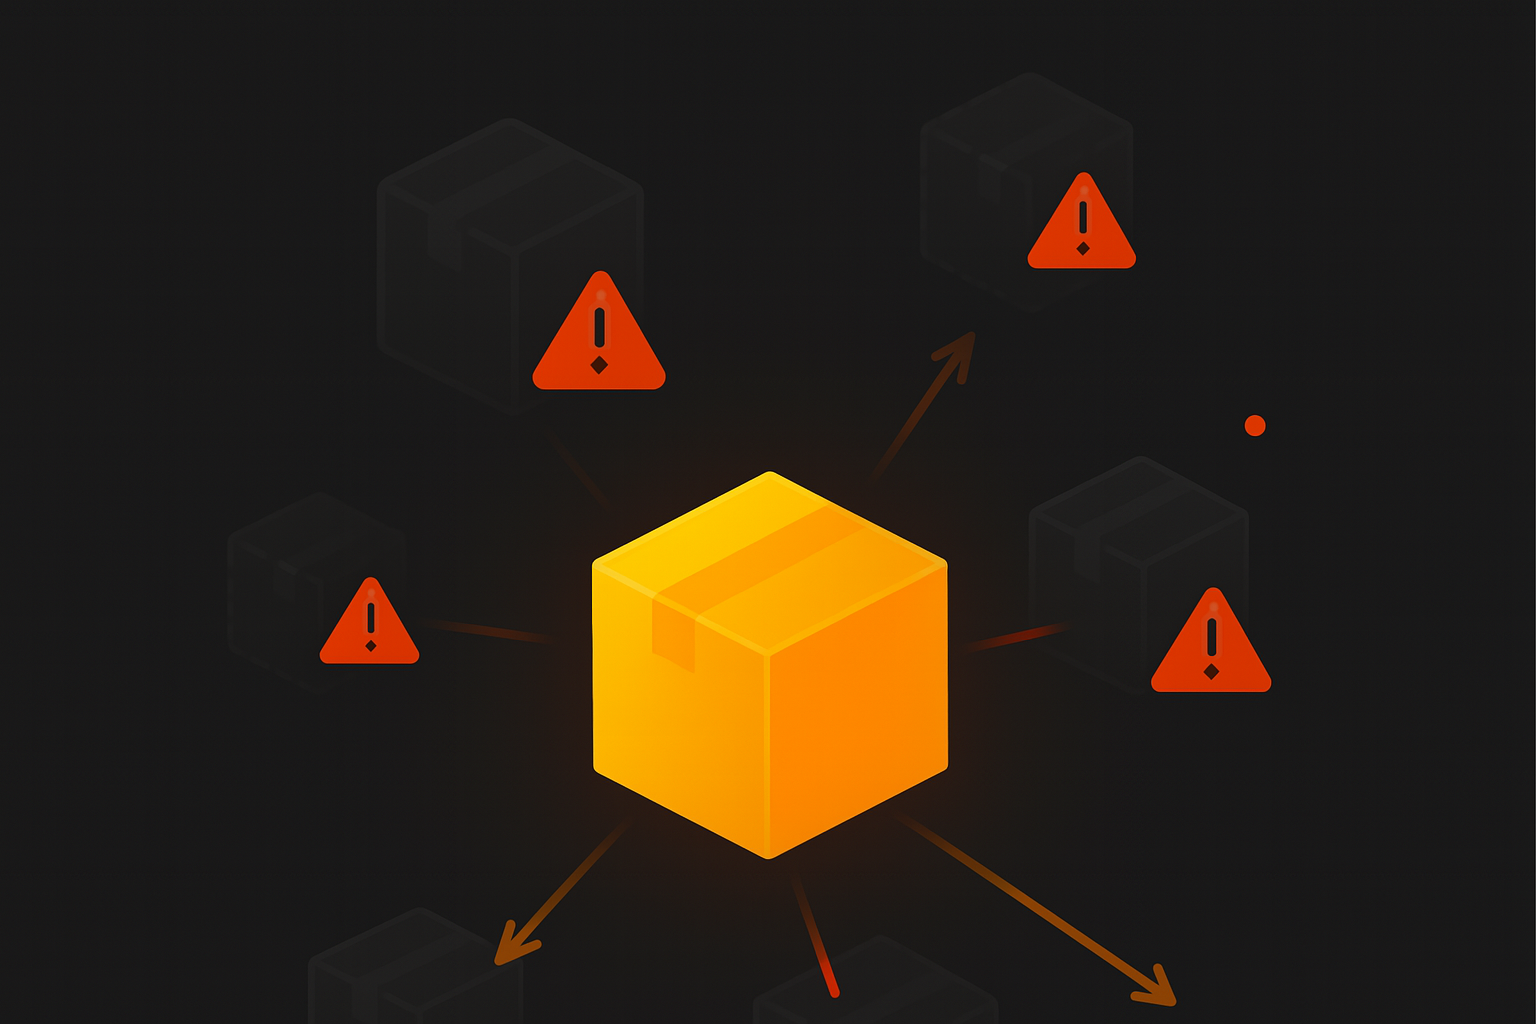
4. Automate Repetitive Tasks to Protect Decision-Making Time
Many fast-growing sellers are not working longer hours — they’re reducing manual work wherever possible.
Automation creates more time for strategic decisions instead of operational maintenance.
Simple examples include:
- automated performance reporting
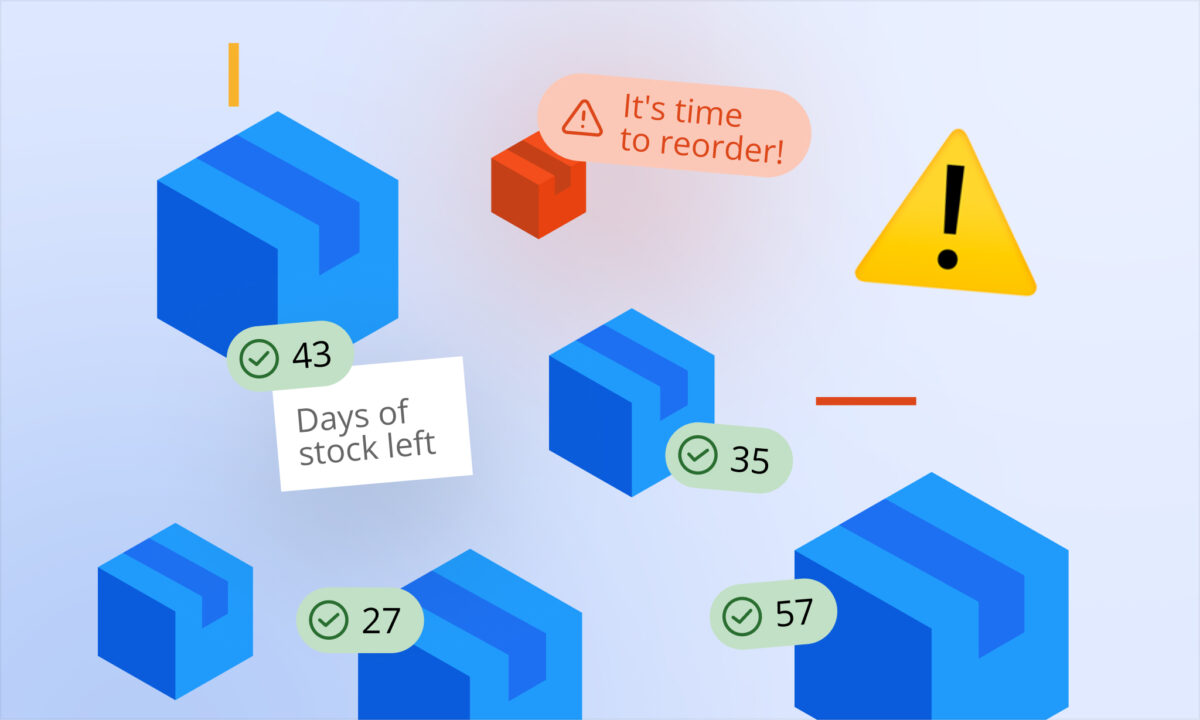
- inventory risk alerts
- recurring optimization review routines
- profitability monitoring
- scheduled PPC checks
The objective isn’t to build overly complex systems.
The objective is consistency.
When repetitive processes run automatically, it becomes easier to focus on:
- product decisions
- growth opportunities
- advertising strategy
- customer experience
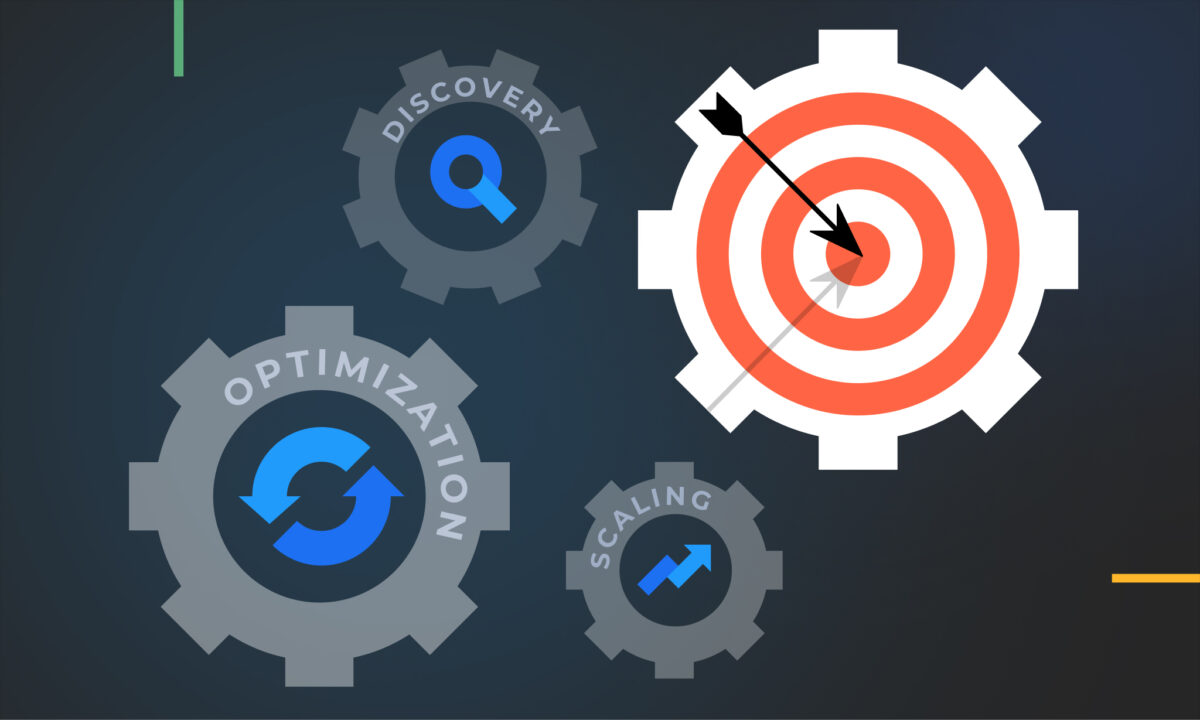
Final Thoughts
Scaling an Amazon business becomes more manageable when you focus on four principles:
- follow performance signals
- simplify the customer experience
- expand what already works
- eliminate repetitive busywork
Growth rarely comes from doing everything at once.
More often, it comes from making better decisions consistently over time.