Stockouts are almost never a forecasting problem alone. They are a pipeline problem — and a restock fails at one of five specific points: the demand forecast, the lead-time model, visibility into stock in transit, the timing of the signal that tells you to act, and the decision about which SKU gets the reorder cash. A seller who fixes only the forecast still runs dry, because the other four failure modes are untouched. This guide maps each failure point to the sellerboard feature that closes it — Inventory Planner inputs, purchase orders and FBA shipments, alerts, and the Profit Dashboard — and shows the arithmetic behind each decision so you can size buffers and reorder points against your own numbers instead of a rule of thumb.
Why does a stockout cost more than the sales you obviously lost?
The visible cost of running dry is the units you didn’t sell. That’s the smallest part of the bill.
A stockout removes your sales velocity, and sales velocity is an input to organic ranking. When stock returns, you re-enter at a weaker position than you left, which means the recovery period carries lower conversion and usually higher PPC cost to rebuild momentum. Meanwhile any advertising still pointed at the ASIN spends against an unavailable offer, and competitors capture the demand your listing trained buyers to expect.
There is also a direct fee consequence. Amazon’s low-inventory-level fee charges a per-unit surcharge on FBA units while your stock is thin relative to demand, so the period before a stockout is already costing money on every unit you do ship. The fee triggers when your historical days of supply falls below 28 days on both the short-term (30-day) and long-term (90-day) measures. As of the January 2026 changes it is calculated at the seller-FNSKU level rather than parent-ASIN, and it extends to small and large bulky sizes; Grocery is exempt. Per-unit rates vary by size tier and by how far below the threshold you sit — verify current rates against your Seller Central fee schedule before modelling a specific SKU.
Put together, a stockout is a four-part cost: lost contribution, rank decay, wasted ad spend, and the low-inventory surcharge you paid on the way down.
sellerboard makes the first part measurable directly. The Missed Profit column in the Inventory Planner estimates profit lost to stockouts over the trailing 90 days, derived from the product’s sales velocity and average profit per unit; hovering shows the unit count and the lost sales value behind the figure. That converts “we ran out for a couple of weeks” into a number you can rank SKUs by.
Worked example. A SKU selling 25 units/day at $6.00 net profit per unit goes out of stock for 18 days:
| Component | Calculation | Cost |
| Lost contribution | 18 days × 25 units × $6.00 | $2,700 |
| Low-inventory surcharge (14 days thin before the stockout, ~$0.55/unit) | 14 × 25 × $0.55 | $193 |
| Rank/ads recovery (indicative, 3 weeks at 15% depressed conversion) | 21 × 25 × 0.15 × $6.00 | $473 |
| Approximate total | ~$3,366 |
The lost units account for roughly 80% of the damage. The remaining 20% is the part sellers systematically leave out of the business case for holding more buffer.
What makes a demand forecast wrong, and which inputs fix it?
All forecasting in sellerboard is built on sales velocity — units sold per day. The refinements matter more than the base metric.
Out-of-stock adjustment. Raw velocity understates true demand for any SKU that has already had a stockout, because the zero-sales days are averaged in as though demand were zero. sellerboard’s Inventory Planner works from sales velocity adjusted for out-of-stock days, which prevents the failure mode where a stockout causes an artificially low forecast, which causes a smaller reorder, which causes the next stockout.
Adjusted sales velocity weighting. You can weight different lookback windows — 3, 7, 30 days and longer — against each other. Short windows react fast but overreact to a single promotion or a lightning deal; long windows are stable but lag a genuine trend. The practical setting depends on how the SKU behaves:
| SKU behaviour | Weighting bias | Why |
| Stable, mature, year-round | Longer windows (30+ days) | Suppresses noise; trend is real signal |
| Trending up or newly launched | Shorter windows (3–7 days) | Recent data is the only representative data |
| Promo-driven or deal-heavy | Longer windows | Prevents a deal spike from sizing the next PO |
| Seasonal | Longer windows plus seasonality settings | Recent weeks may be structurally unrepresentative |
Seasonality. For predictable annual demand shifts, a velocity average taken in September is a poor basis for a Q4 order. Seasonality settings let the forecast reflect the shape of your year rather than the last 30 days of it.
Projected monthly growth rate. If the business is growing, a backward-looking average is structurally short. The growth-rate input tilts the forecast forward so the reorder quantity covers the demand you expect, not the demand you had.
The failure mode this section addresses: a forecast that is technically accurate about the past and therefore wrong about the future.
Why is the lead-time model the most common cause of a stockout?
Because most sellers underestimate it, and they underestimate it in a specific way — by counting the steps they pay invoices for and omitting the ones they don’t.
sellerboard breaks the supply chain into separate inputs rather than one blended “lead time”: manufacturing time, shipping to prep center, shipping to FBA, and an FBA buffer for check-in. Amazon receiving and check-in is real, variable, and invisible on any invoice — which is exactly why it gets dropped from mental models.
Worked example. Same SKU at 25 units/day.
| Stage | Days |
| Manufacturing | 30 |
| Supplier → prep centre | 20 |
| Prep centre processing | 5 |
| Prep centre → FBA | 7 |
| FBA check-in buffer | 5 |
| True total lead time | 67 |
Now compare the reorder trigger under the full model versus the common shortcut of “30 days manufacturing + 20 days shipping = 50 days”:
| Model | Lead time | Safety stock (21 days) | Reorder trigger |
| Full pipeline | 67 days | 525 units | 2,200 units |
| Shortcut | 50 days | 525 units | 1,775 units |
The shortcut reorders 425 units too late — 17 days of cover. At $6.00 net profit per unit that single modelling error is worth about $2,550 in missed contribution, and it repeats every cycle until the input is corrected. This is the highest-leverage 10 minutes of configuration in the whole tool.
The desired target stock range after reorder (expressed in days) then determines how much to order once the trigger fires, and Recommended Reorder Quantity does that arithmetic against your pipeline rather than leaving it to a spreadsheet.
How do you avoid double-ordering or under-ordering stock you already own?
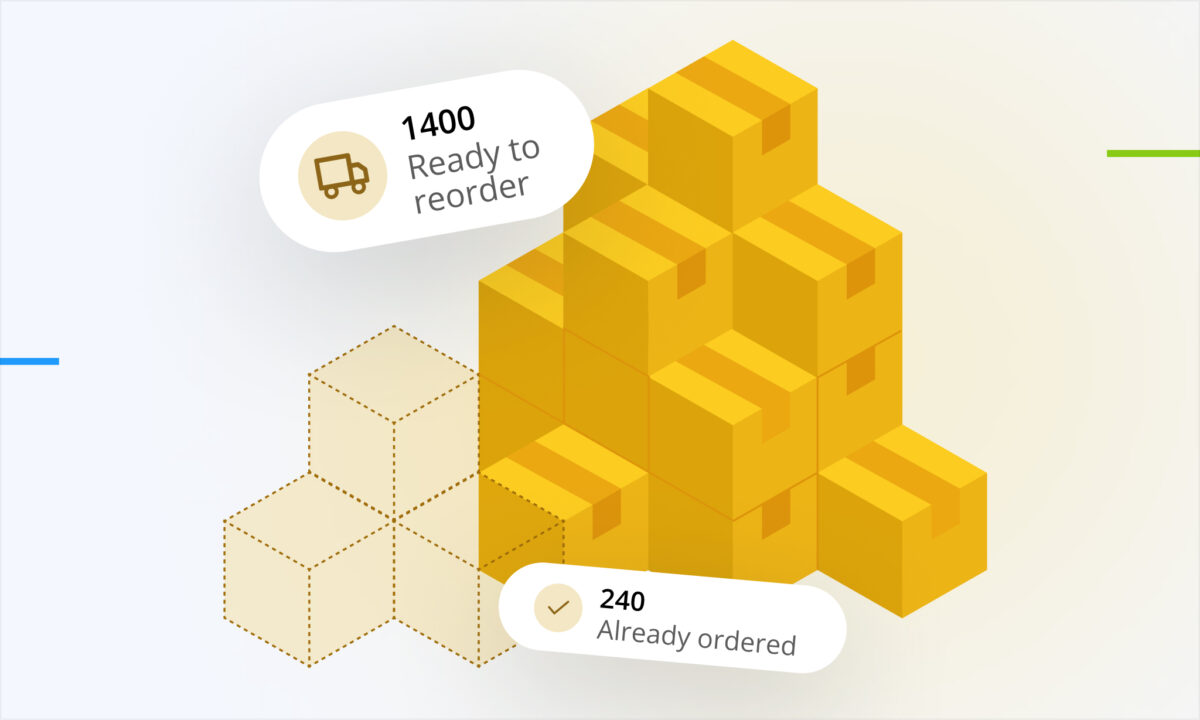
By forecasting against the whole pipeline, not just what is sellable today. A seller looking only at FBA available stock will panic-order units that are already on a boat; a seller who forgets a prep-centre pallet exists will order short.
sellerboard’s Inventory Planner accounts for stock at every stage:
- Available FBA and FBM stock
- Reserved units
- Stock at your prep centre (updated automatically)
- Ordered stock still in production or transit
- Units sent to FBA via shipments
- AWD stock (available and reserved, with a hover breakdown) and Sent to AWD for units in transit but not yet available, on Amazon.com
One planning subtlety worth flagging: AWD inventory does not count toward your FBA historical days of supply. AWD is an excellent buffer against stockouts, but parking units there does not protect you from the low-inventory-level fee, which reads FBA stock only. Treat those as two separate problems.
Purchase orders and FBA shipments feed this view rather than sitting beside it — as a PO moves from draft through ordered, shipped and closed, the “Ordered” and “Prep Center Stock” values in the planner update, and closing a PO can push accurate landed COGS back onto the product.
Does Amazon’s own restock recommendation add anything?
It does, as a second opinion rather than a substitute. sellerboard surfaces Amazon’s recommended ship-in date and recommended ship-in quantity, derived from Amazon’s own historical days-of-supply view, alongside sellerboard’s calculations.
The two use different logic and different assumptions, which makes disagreement informative:
| Situation | Likely reading | Action |
| Both agree | Model is sound | Order with confidence |
| Amazon says sooner | Amazon may see the low-inventory threshold approaching before your buffer does | Check historical days of supply; consider a partial interim shipment |
| Amazon says more units | Your growth rate or seasonality inputs may be too conservative | Revisit forecast inputs |
| sellerboard says sooner | Your true lead time is longer than Amazon’s generic assumption | Trust your own lead-time model |
Amazon’s figure is the useful cross-check specifically for fee avoidance, because it is computed on the same days-of-supply basis the fee uses.
How do you catch inventory that never arrives?
A shipment that leaves your prep centre and is only partially checked in creates a stockout that no forecast predicts, because your planner believes the units exist.
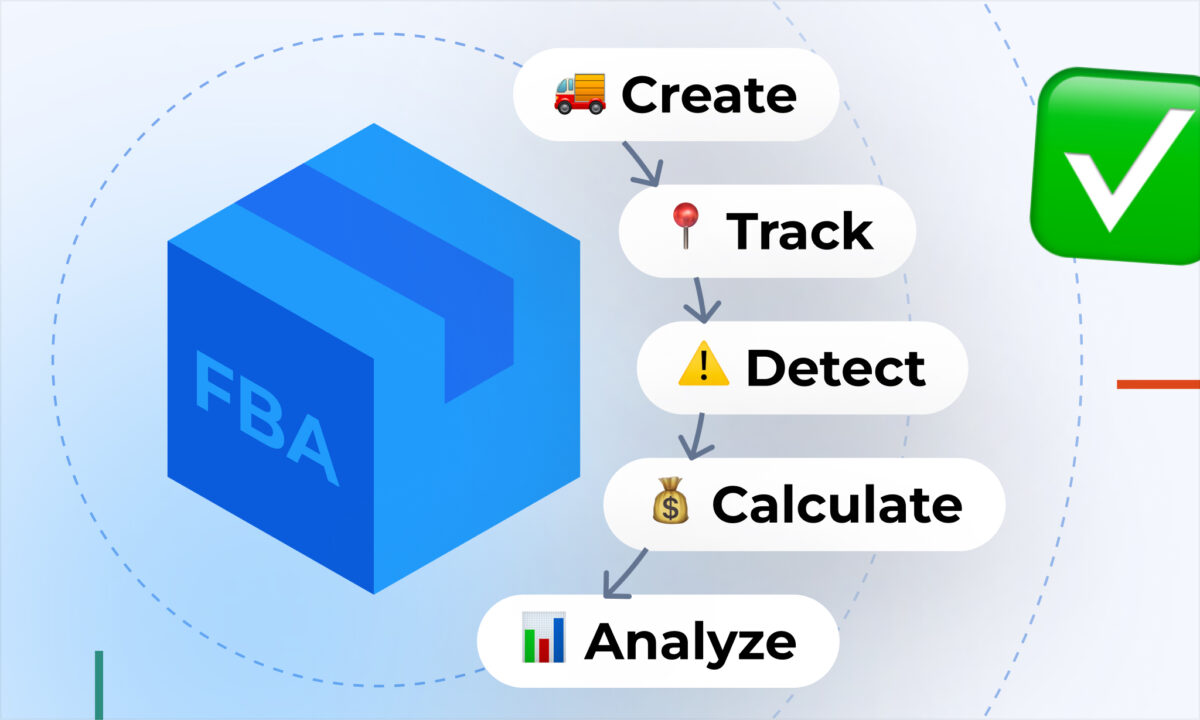
sellerboard’s FBA shipments module lets you create inbound shipments, define prep and packing details, generate FNSKU and box labels, then track check-in progress and compare what you sent against what Amazon actually received. Discrepancies surface while they are still recoverable rather than weeks later.
Two things to configure here:
- The inbound quantity alert — notification when FBA shipment quantity doesn’t match Amazon’s inbound quantity, or when a shipment is closed but not fully received. That is your trigger to open a reconciliation case.
- Money Back follow-through — units lost or damaged in the inbound process are reimbursable, and the Lost & Damaged report exists to find them. Note that reimbursements are compensation, not profit: the double-entry treatment means the recovery largely offsets the corresponding cost rather than adding margin. Amazon decides each claim on its merits, so treat any figure as an estimate rather than expected income.
Which alerts actually prevent stockouts?
Alerts are a timing layer. The value isn’t the information — it’s receiving it while action is still cheap. Four alert types bear directly on stock continuity:
| Alert | What it prevents |
| Upcoming stock shortage | The core reorder-point signal; requires production times configured in the Inventory feature |
| Unusually large order | A single bulk order silently consuming weeks of cover and triggering an unplanned stockout |
| Inbound quantity mismatch | Phantom inventory your forecast is counting but Amazon never received |
| Listing suppression / Buy Box loss / new seller | Demand shocks in both directions — suppression collapses velocity and corrupts your forecast; regaining the Buy Box spikes it |
That last row is the one most sellers don’t connect to inventory. A listing suppressed for ten days depresses measured velocity, which lowers the forecast, which undersizes the next order — the stockout arrives a cycle later and looks unrelated to the suppression that caused it. Fee-change alerts matter too, since an FBA or referral fee increase changes the net profit per unit that your reorder prioritisation depends on.
Configuration discipline is what keeps this working. sellerboard supports per-alert-type email routing, so different team members receive different categories, and the Alerts Dashboard functions as a worklist where each alert carries a product, timestamp and event type, and can be commented on and marked resolved. Route the stock-critical alerts to whoever owns purchasing, keep the low-urgency ones in the dashboard for weekly review, and resist enabling everything by email — an alert stream nobody reads is indistinguishable from no alerts.
How should the Profit Dashboard change which SKU you restock first?
This is the failure mode that survives even a perfectly configured planner: ordering on time, in the right quantity, for the wrong SKU.
Reorder cash is finite. If the reorder list is sorted by units sold, capital flows to whatever moves fastest — which is not necessarily what earns most or ties up least cash. Sorting by profit velocity (units sold × true net profit per unit) frequently reverses the ranking:
| SKU | Units/day | Net profit/unit | Daily profit | Velocity rank | Profit-velocity rank |
| A | 100 | $2.00 | $200 | 1 | 2 |
| B | 30 | $8.00 | $240 | 2 | 1 |
The consequence for stockout planning is counterintuitive but important: safety stock should be weighted by profit contribution, not unit throughput. A day out of stock on SKU B costs $240; on SKU A it costs $200. The slower-selling SKU is the more expensive one to run dry, so it deserves the more conservative buffer — the opposite of what a velocity-weighted rule produces.
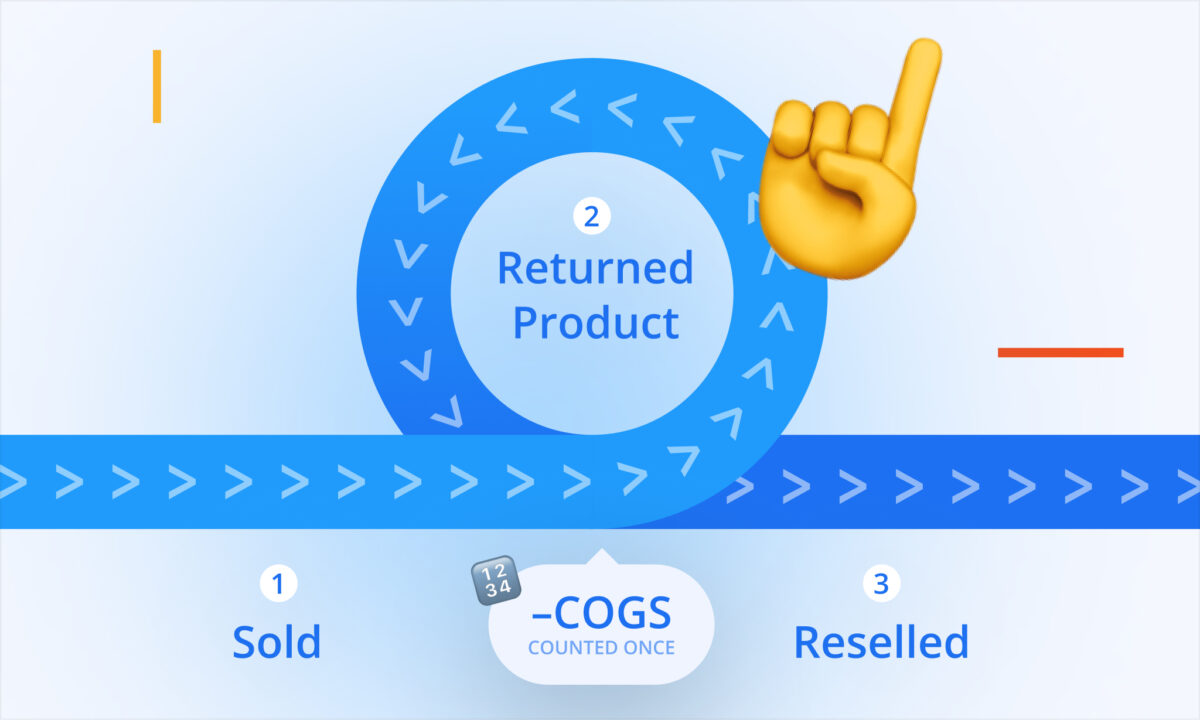
This is where the Profit Dashboard is load-bearing rather than decorative. True net profit per unit — after referral fees, fulfilment fees, PPC, returns and allocated storage — is the multiplier that makes profit velocity computable, and it is not a number available in Seller Central at SKU level. Accurate COGS underpins all of it; the FIFO costing method matters here, because if landed costs have moved between batches, an averaged cost distorts the per-unit profit that your entire prioritisation depends on.
Add two columns to your reorder view: profit velocity, and return on inventory cash (periodic net profit ÷ cash tied up in that SKU’s stock). Sort by the first, break ties with the second.
What stops “never stock out” from becoming an overstock problem?
An unlimited buffer eliminates stockouts and destroys returns. The constraint on the other side is holding cost, and in 2026 it has two components worth planning against.
Monthly storage. For standard-size US inventory, roughly $0.78 per cubic foot from January through September, rising to about $2.40 per cubic foot in Q4 — approximately triple. Buffer stock that sits through October–December is charged at the year’s most expensive rate.
Aged inventory surcharge. This now begins at 181 days in a fulfilment centre, considerably earlier than the 271–365 day trigger of the retired long-term storage fee. It stacks on top of monthly storage, escalates in steps, and reaches roughly $6.90 per cubic foot past a year. Many reorder models still assume the old threshold. (Amazon revises these tiers; verify against the live schedule.)
Practical framing: treat 181 days as a hard planning ceiling and size POs so units clear well before it, especially anything staged for Q4. The workable band for most SKUs sits above the 28-day fee threshold and comfortably below the aging line — roughly 35–55 days of cover for steady sellers, with more for high-profit-velocity SKUs and less for capital-heavy thin-margin volume.
For sellers across multiple regions, the sales/stock map adds a dimension the SKU-level view misses: country-level distribution in Europe, state-level in the US. A region with high sales and light stock is heading for a regional stockout even when your aggregate cover looks healthy; the reverse means overstock accruing fees. Comparing regional sell-through (units sold ÷ stock on hand) tells you where the next shipment should go, not just how large it should be.
What does the operating cadence look like?
Configuration is one-off; prevention is a habit.
| Frequency | Task | Where |
| Daily | Clear stock and inbound alerts | Alerts Dashboard |
| Weekly | Sort by Days Until Next Order; action anything inside lead time | Inventory Planner |
| Weekly | Check FNSKUs approaching 28 days of supply | Historical days of supply |
| Weekly | Reconcile open shipments — sent vs received | FBA Shipments |
| Fortnightly | Re-sort reorder list by profit velocity | Profit Dashboard + Planner |
| Monthly | Review Missed Profit; find which stockouts actually cost you | Inventory Planner |
| Monthly | Audit lead times against what actually happened | Supplier settings |
| Quarterly | Revisit seasonality and growth-rate inputs | Planner settings |
| Quarterly | Verify Amazon fee schedule against your model | Seller Central |
The monthly lead-time audit deserves emphasis. Lead times are entered once and then quietly drift as suppliers slip and freight conditions change. A model that was correct in January and is 12 days optimistic by June will cause a stockout that looks like a forecasting failure and isn’t.
Common mistakes
- Counting only invoiced stages in lead time. Prep processing and FBA check-in are real days.
- Letting a stockout shrink the next order. Use out-of-stock-adjusted velocity, or the failure compounds.
- Weighting safety stock by units instead of profit. Your highest-margin SKU is the costliest to run dry.
- Treating AWD stock as fee protection. It buffers stockouts; it doesn’t count toward FBA days of supply.
- Enabling every alert by email. Noise produces the same outcome as silence.
- Ignoring listing and Buy Box alerts as “not inventory.” They corrupt the velocity your forecast runs on.
- Stocking deep into Q4 without checking the aging clock. Triple storage rates plus a 181-day surcharge.
- Averaging COGS across batches with different landed costs. It distorts every downstream profit decision.
FAQ
How many days of stock should I keep? There is no universal figure, but the band is bounded on both sides: above 28 days of historical supply to stay clear of the low-inventory-level fee, and well below 181 days to stay clear of the aged-inventory surcharge. Roughly 35–55 days suits most steady sellers, adjusted upward for high-profit-velocity SKUs and long or unreliable lead times, and downward for capital-heavy thin-margin lines.
Why does sellerboard’s reorder date differ from Amazon’s? Different inputs. Amazon works from its own historical days-of-supply view; sellerboard works from your configured manufacturing, shipping and prep times plus your buffer, growth and seasonality settings. When Amazon says “sooner,” it is usually detecting the fee threshold; when sellerboard says “sooner,” your real lead time is longer than Amazon’s generic assumption. Treat the two as cross-checks.
Does AWD stock protect me from the low-inventory-level fee? No. AWD is useful as an overflow buffer and shortens effective replenishment time, but the fee is assessed on FBA days of supply, and AWD units don’t count toward it.
How do I know what stockouts have actually cost me? The Missed Profit column in the Inventory Planner estimates profit lost to stockouts over the past 90 days from sales velocity and average profit per unit, with a hover breakdown of missed units and lost sales value. It’s the fastest way to see which stockouts were expensive rather than merely annoying.
Should a slow-moving product ever get restock priority over a fast one? Yes — when its profit velocity or its return on inventory cash is higher. A SKU selling a third as many units can out-earn a fast mover while tying up half the capital, which also makes it the more expensive one to run out of.
Can I prevent stockouts caused by a single huge order? Not prevent, but detect immediately. The unusually large order alert flags bulk purchases that consume weeks of cover at once, so you can start an expedited shipment the same day rather than discovering the gap at the next weekly review.
Does any of this apply to FBM? Partly. The Inventory Planner covers FBM stock and the forecasting logic is identical, but the low-inventory-level fee is FBA-only, as are Amazon’s storage and aging surcharges. FBM sellers keep the forecasting and alerting layers and drop the fee-avoidance constraints.
Stockout prevention isn’t a single feature. It’s a forecast that reflects real demand, a lead-time model that includes every stage, visibility across the whole pipeline, alerts that arrive while action is cheap, and a reorder list sorted by profit rather than throughput. Configure those five layers once, run the cadence, and stockouts become an exception you diagnose rather than a recurring cost you absorb.