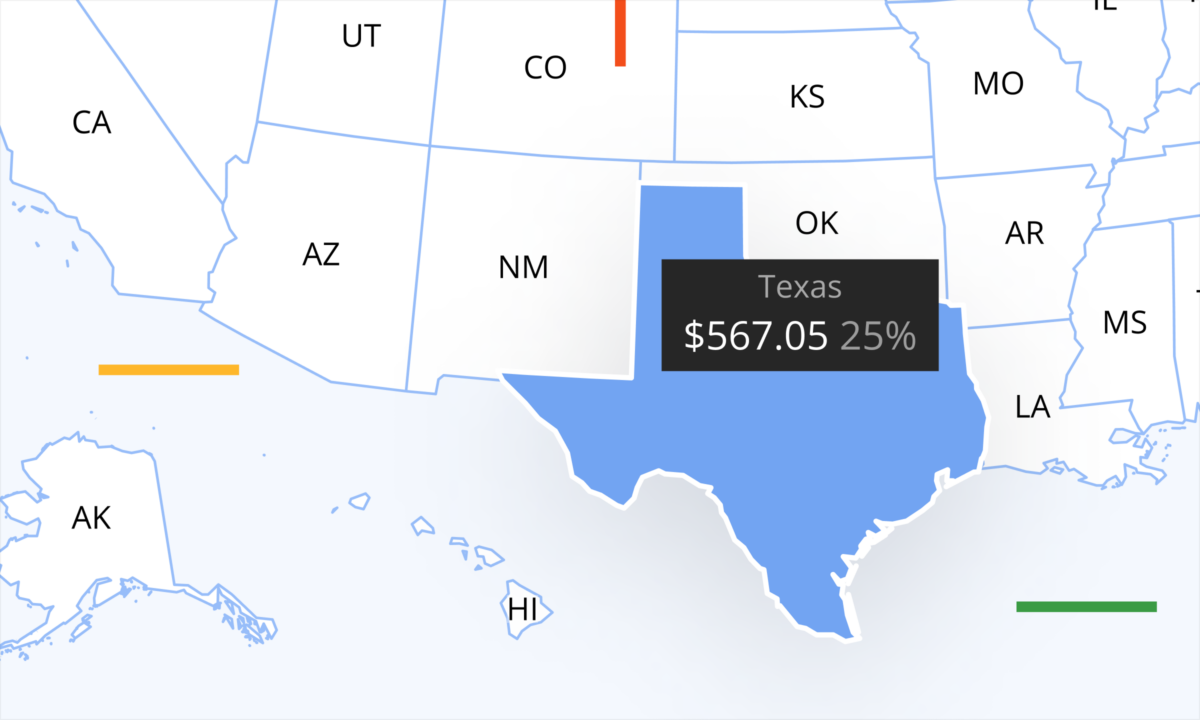
Sellerboard’s sales/stock map is a powerful new feature designed to enhance your profit analytics by providing a visual breakdown of sales and stock distribution across regions. Whether you sell in Europe or the US, this feature gives you actionable insights to optimize your business.
For European marketplaces, the map displays country-level data, while for the US, it breaks down information by state. This level of detail helps you understand where your products are selling best and how your inventory is allocated, making it easier to identify opportunities for growth and efficiency.
How it works
The map view, available in the profit dashboard, lets you toggle between sales and stock distribution to analyze your regional performance at a glance. Below the map, a detailed table provides metrics for all products sold by country or state during the selected time period, including products sold, current stock levels, orders and units sold, refunds, sales revenue, Amazon fees, gross profit, and more.
Why it matters
Accurate profit analytics relies on having detailed and actionable data. The sales/stock map empowers you to:
- Identify high-performing regions or states.
- Adjust inventory allocation to avoid stockouts and reduce excess stock.
- Plan restocks more effectively by combining these insights with sellerboard’s Inventory Planner.
With the sales/stock map, you can make smarter, data-driven decisions to improve operational efficiency and boost profitability. Access the feature in the profit dashboard today and take the next step toward mastering your profit analytics!
