Whether you’re tracking profitability, managing PPC, or checking refund rates, the right filters make all the difference. In sellerboard, filters don’t just shape the data you see – they shape how efficiently you work.
Why Filters Matter
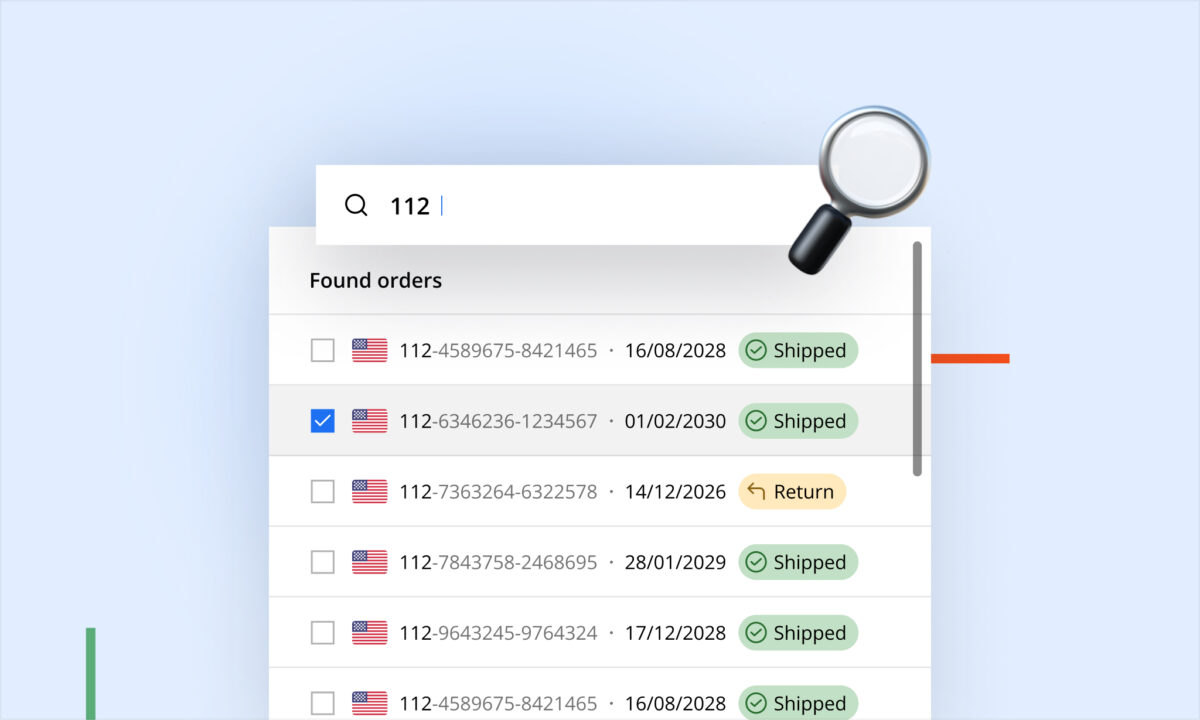
sellerboard gives you the tools to zero in on exactly what you need. Want to track a specific product’s performance in the UK marketplace over the last 30 days? Done. Need to analyze refunds for a single SKU or compare net profit across marketplaces? It’s all just a few clicks away.
But here’s the best part: your filters are saved in the URL.
That means every configuration – products, marketplaces, periods, metrics, views, even sorting – can be bookmarked and instantly reloaded later.
What Can Be Filtered?
Here are just a few of the ways you can tailor your views across sellerboard’s dashboards:
✅ Product selection – Filter by SKU, ASIN, product name, or tags
✅ Period filter – Use presets like “Last 30 days,” “Month to date,” or set custom ranges
✅ Marketplace selection – Filter by one or multiple marketplaces
✅ Tile selection – If you select “Last month” or “Today” in the Tiles view, the data across the dashboard adjusts – and the selection is stored in the link
✅ Sorting – Sort your tables by sales, margin, ROI, refunds, or any other metric – it’s saved
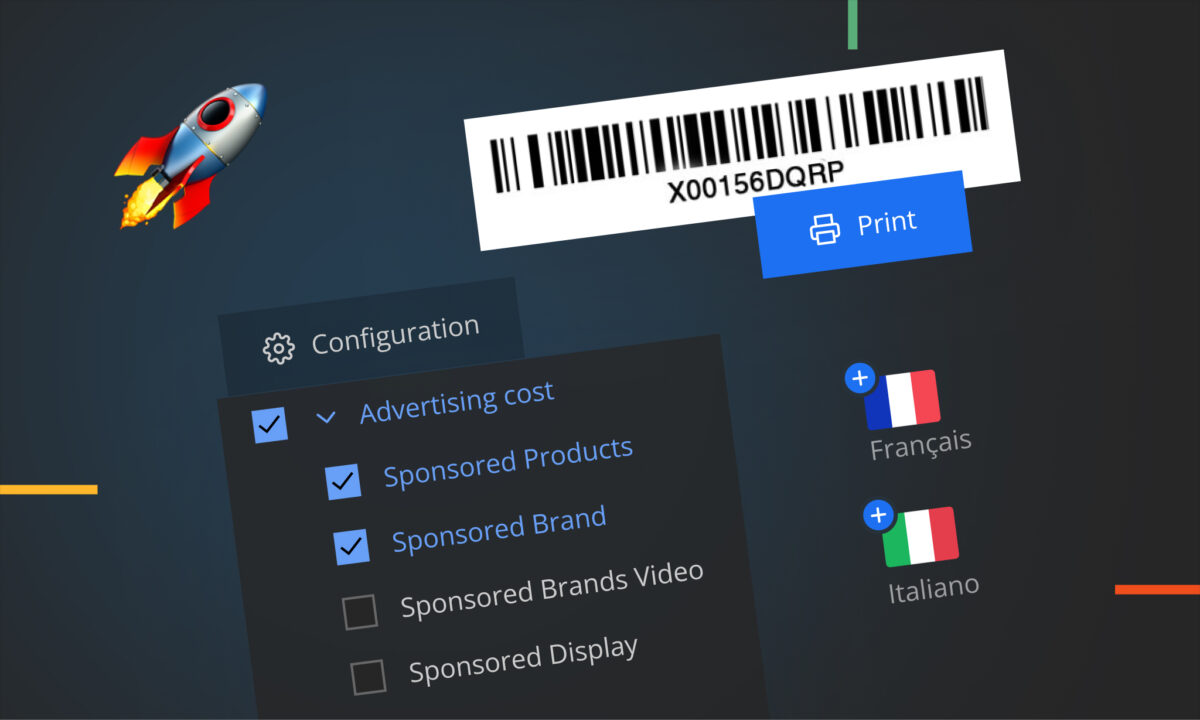
✅ Chart configuration – Select the metrics you want in the Chart view (e.g., Units Sold, Advertising Cost, Net Profit) – saved in the link
✅ Map view toggle – Switch between sales or stock map – it’s in the URL
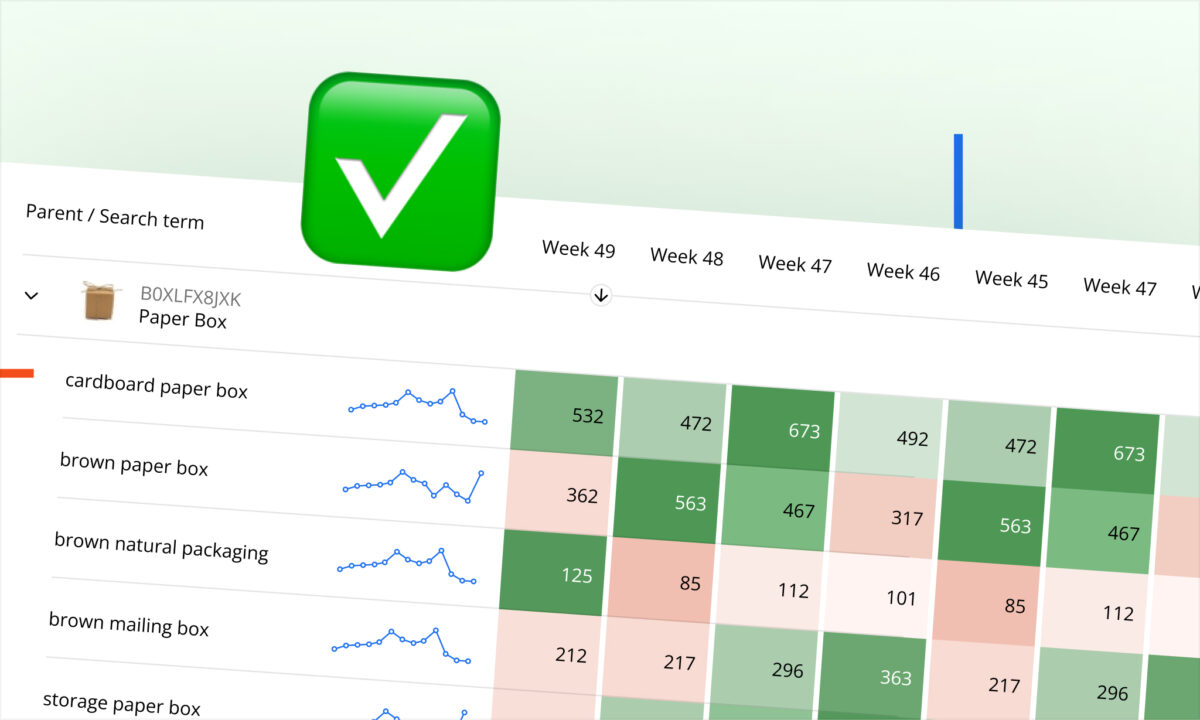
✅ Trends view customization – Your selected metric and sorting order are also stored
✅ Works in PPC dashboard too – Campaign filters, timeframe, metric selection – all reflected in the address bar
What This Means for You
You don’t need to reapply filters every time you log in. Instead, create bookmarks for the exact views you use most:
- Your best-performing SKUs this quarter
- Refund analysis for Germany
- ROI trends across ad campaigns
- Inventory status by region
Just bookmark the filtered page once, and return to it anytime.
Try it yourself:
Set your favorite filters, then copy the URL or add it to your browser bookmarks. You’ll land right back in your preferred view next time – fully configured.
This small detail can have a big impact on your workflow.
Want help building your own filtered dashboards? Reach out – we’re happy to help.
Happy analyzing!