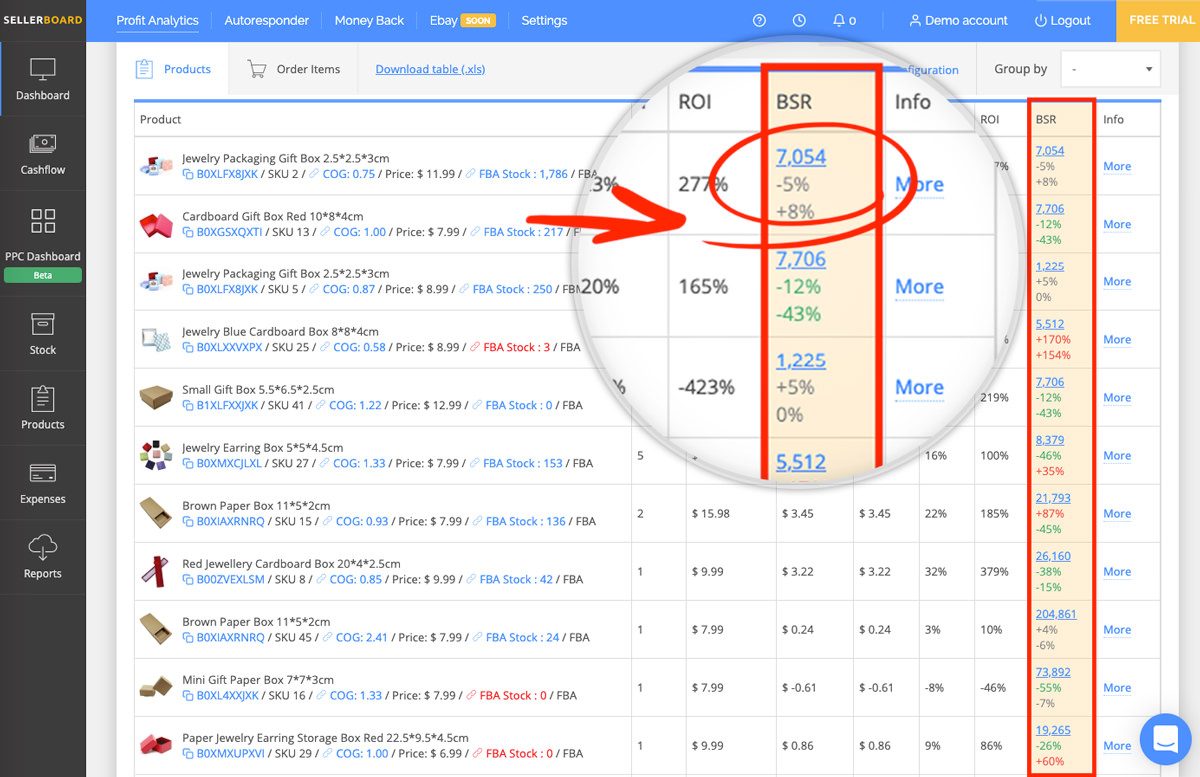
We have a feature in sellerboard which helps you understand this and take action if necessary: Display of the BSR changes in % directly in our dashboard.
Now you immediately see how well your products are selling compared to the competition.
In the dashboard, you can now view the BSR field in the product table.
The field shows 3 values:
- Current BSR of the product
- % of the current BSR changes compared to the average BSR of the last 7 days
- % of changes of the 7-day average compared to the past 30-day average
If the % numbers are approximately 0% (+/- 10%), it means that the product does not lose (or gain) any market share and your sales performance is consistent with the whole category (or market).
So, on a day with bad sales, but constant BSR you can stay relaxed, it’s not a specific problem to your product.
On the other hand, if you notice a substantial increase in BSR, this means that you are losing market share and it’s time to act.
Would you like to check this feature out?
sellerboard is an accurate profit analytics service with additional tools: follow-up mail campaigns, inventory management, reimbursements for lost & damaged stock and other FBA errors, PPC optimizer, listing change alerts.
Get 1 month of free access to sellerboard using this link: https://www.sellerboard.com/blog


