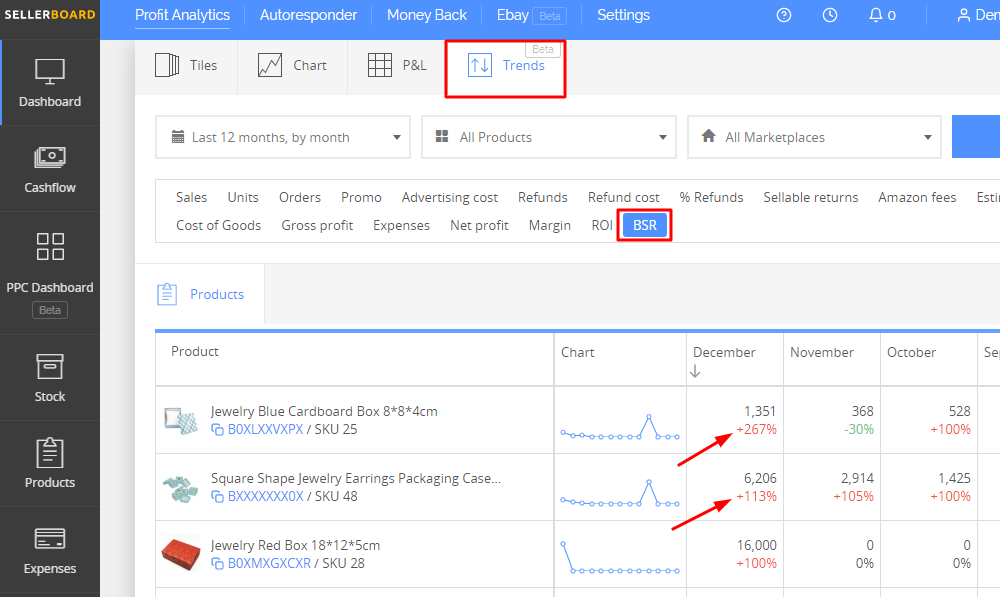
sellerboard has a new cool feature and we’re really excited to share it with you: Trends!
Problem: If you have >5 products/variants on amazon, it’s hard to keep track of all important KPI’s for every product/variant to make sure you don’t have a negative trend. Such KPI’s are for example: BSR, sales, returns, Profit. If one of these has worsened lately, the seller should take action (e.g. decrease price, check the quality, run ads, etc).
Solution: We added a new tab in the sellerboard dashboard: Trends. You can select a KPI (e.g. return rate) and a time frame and see a table with all your products and their month by month performance (including the value of the KPI and the % change compared to the last month). Sorting the table will immediately show you all your problematic SKU’s (e.g. the ones where BSR dropped in the last month comparing to the previous month).
Have a great holiday season sales!
sellerboard is an accurate profit analytics service with additional tools: follow-up mail campaigns, inventory management, reimbursements for lost & damaged stock and other FBA errors, PPC optimizer, listing change alerts.
Get 1 month of free access to sellerboard using this link: https://www.sellerboard.com/blog


