As an Amazon seller, you already know how essential it is to have a clear understanding of your profits. The sellerboard profit dashboard is a powerful tool that helps you track and analyze your financial performance, but are you using it to its full potential? Some of its features aren’t immediately obvious, so we’re turning the spotlight on them in this blog post. These tips and tricks can help you improve your workflow and overall experience with sellerboard.
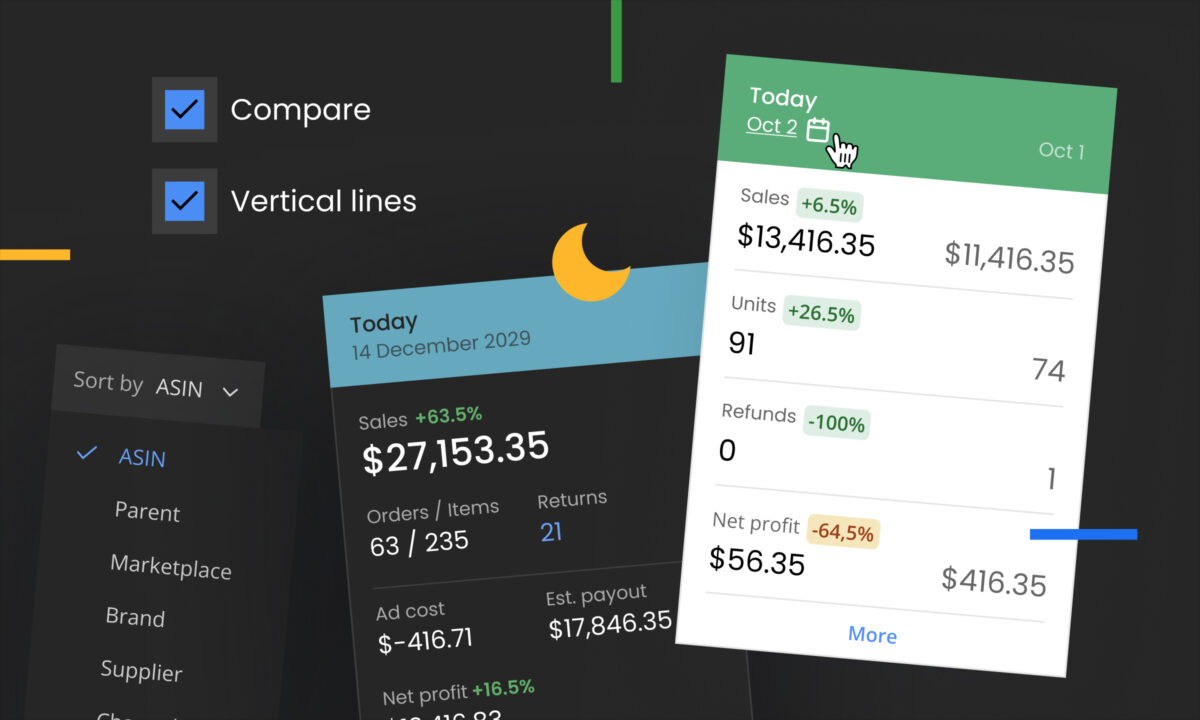
Compare periods on tiles
Tracking performance over time is crucial for understanding the effectiveness of your strategies. With sellerboard, you can easily compare different periods right on the tiles. Simply click on the Period button (located next to the search bar) and select Compare. This feature allows you to see trends, patterns, and changes at a glance, helping you make informed decisions based on historical data.
Select any date range on a tile
Sometimes you need to dig into specific dates to understand what’s really going on with your sales and profits. Did you know that you can select any date range directly on the tiles? Just click on the date range displayed on the tile, and you’ll be able to customize the period to suit your needs. This flexibility is perfect for those moments when you need precise data analysis.
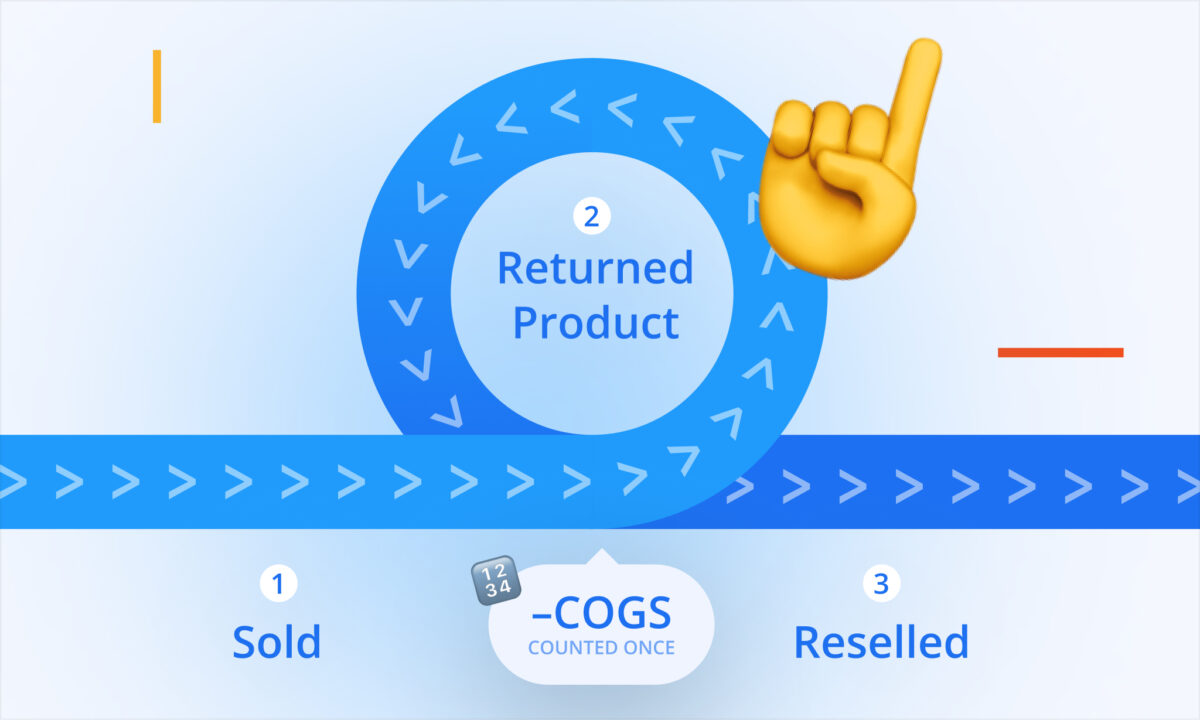
Discover refund reasons
Refunds can be a pain point for any seller, but understanding why they happen is key to reducing them. Sellerboard makes it easy to uncover the reasons behind refunds for a specific period. Just click on the Refunds count on any tile, and you’ll be able to see a breakdown of the reasons. Armed with this information, you can take steps to minimize future refunds and improve customer satisfaction.
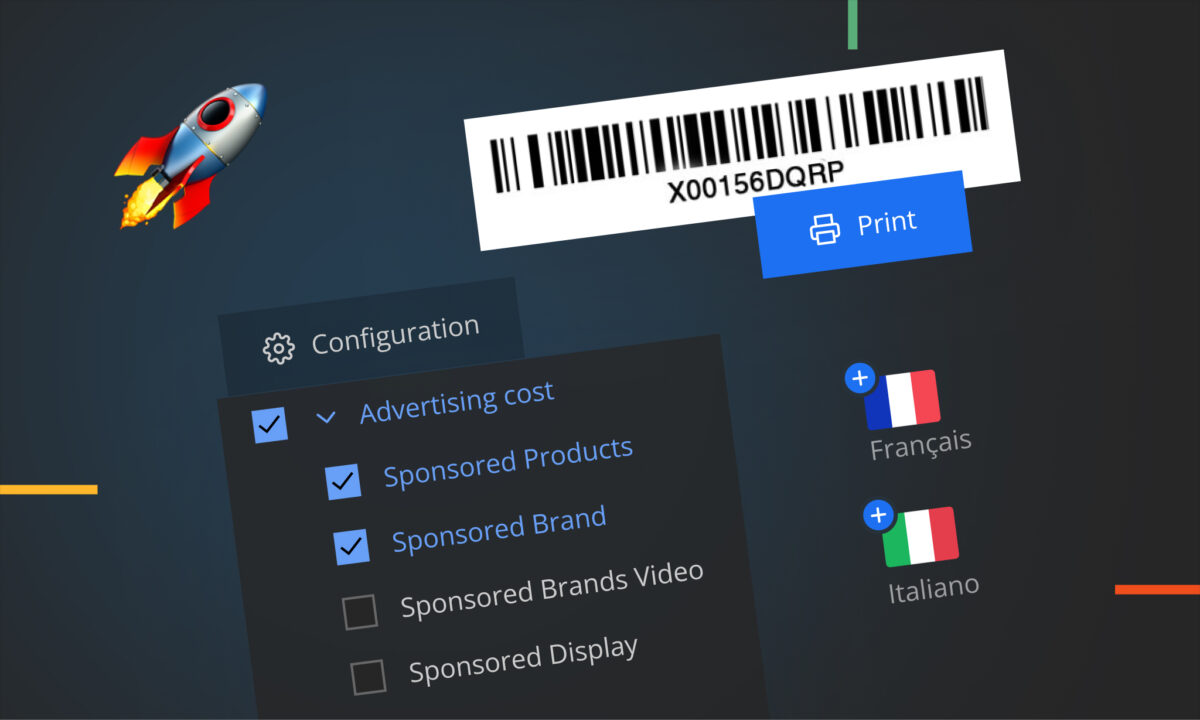
Group elements for better analysis
Organizing your data in a way that makes sense to you is critical for effective analysis. Sellerboard allows you to group elements in the Product or Order Items view by ASIN, Parent, Marketplace, Brand, Supplier, or Channel. To do this, click on the Group by button at the top-right of these views. This feature enables you to see your data in new ways, making it easier to identify trends, outliers, and opportunities.
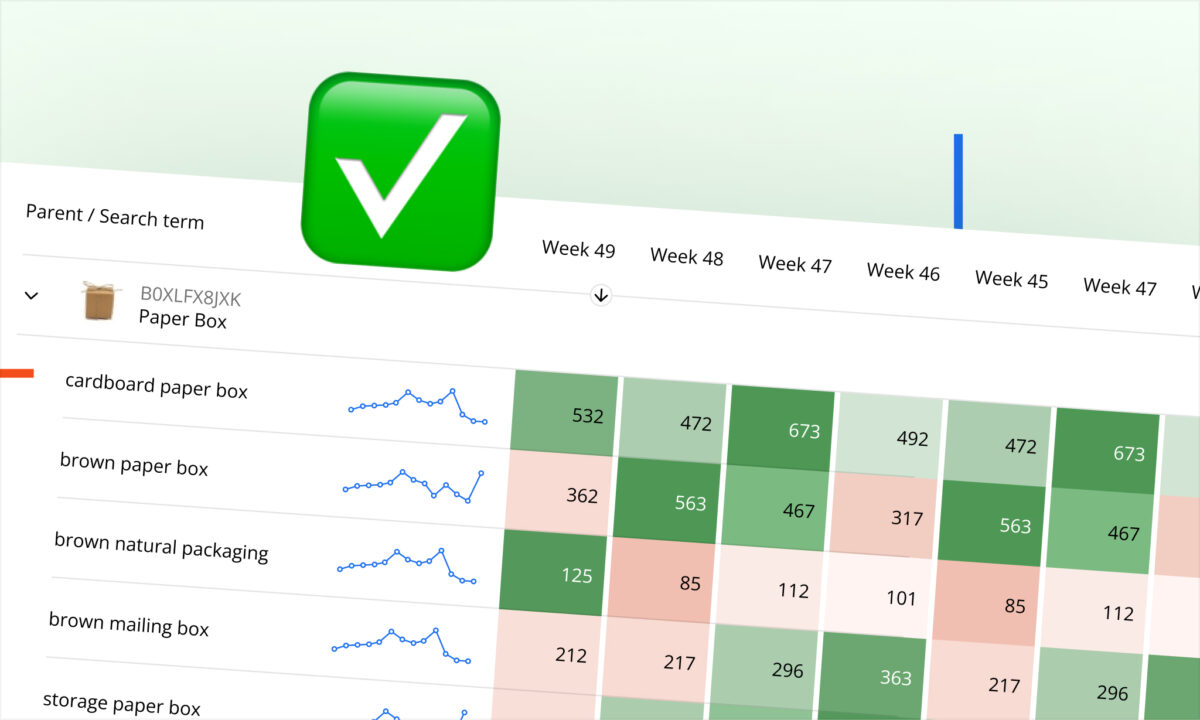
Enable vertical lines for easier reading
When you’re dealing with a lot of data, clarity is key. Sellerboard’s Vertical lines feature helps you read your data more easily by adding a spreadsheet-like outline to all rows and columns in the Products view. To enable this, click on the spreadsheet icon at the very top-right and select Vertical lines. This simple tweak can make a big difference in how quickly you can scan and analyze your data.
Switch to dark mode for late-night work
If you’re working late into the night, you might find the bright screen a bit harsh on your eyes. Sellerboard has a dark mode option that transforms your dashboard into a darker, more eye-friendly interface. To activate it, just click on the moon icon at the top-right of the screen. Dark mode is perfect for those late-night work sessions, helping you reduce eye strain and stay focused.
Conclusion
These tips and tricks are designed to help you get the most out of your sellerboard profit dashboard. By utilizing these features, you can enhance your workflow, gain deeper insights, and ultimately make better business decisions. Try them out today and see how they can improve your experience with sellerboard.
Happy selling!