Most sellerboard users are familiar with the “Tiles view” in the profit dashboard, which provides a quick comparison of key KPIs across different periods. However, there are several advanced features that many users overlook. These features can significantly enhance your analytics capabilities and help you dive deeper into your Amazon business performance. In this blog post, we’re highlighting some of these lesser-known but incredibly powerful tools.
Chart View: Visualize Your Metrics Over Time
Did you know that our Chart View feature allows you to analyze the evolution of specific metrics and KPIs dynamically? With this feature, you can filter and define the subject of your analysis, whether it’s the whole list of ASINs or a specific set, within your chosen date range. Select metrics like sales, advertising costs, Amazon fees, net profit, or use one of our presets such as account overview, refunds analysis, or sales analysis.

Hint: If you’re launching a new product, use Chart View to track its performance over time. Monitor sales growth, advertising spend, and net profit to adjust your marketing strategies and inventory management proactively. This will help you maximize your return on investment and ensure your new product thrives.
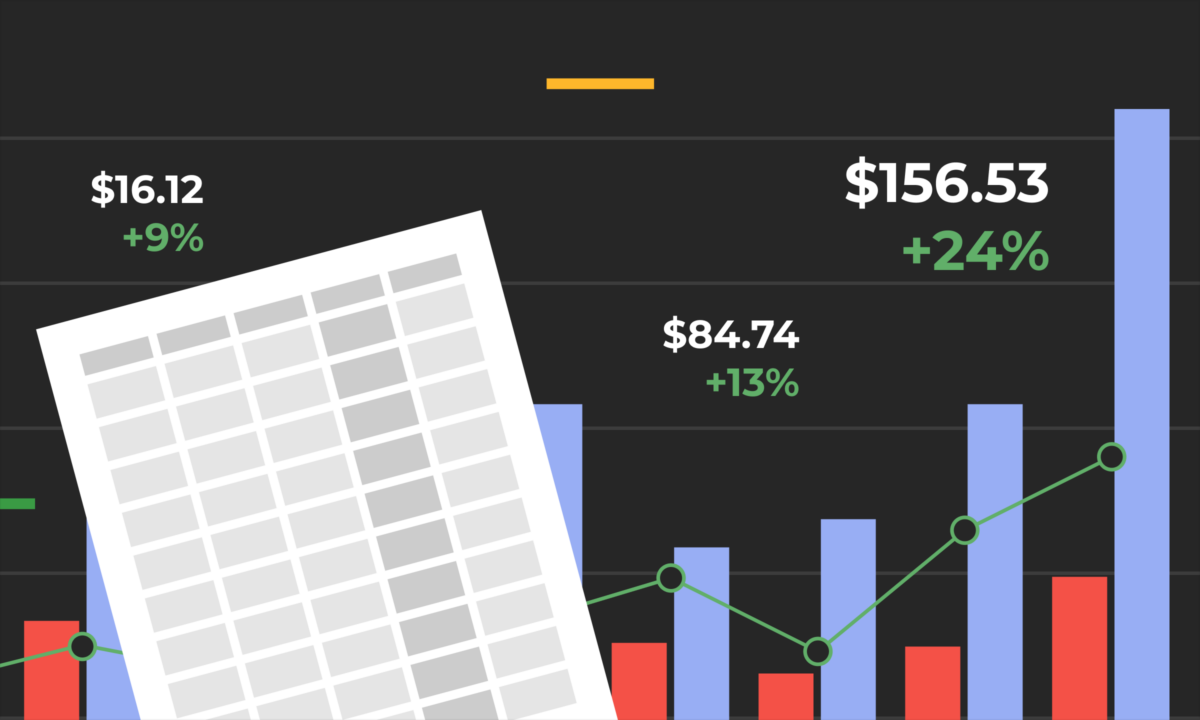
P&L View: Get a Comprehensive Financial Overview
Did you know that our Profit & Loss (P&L) view provides you with a detailed, birds-eye view of your account? This feature breaks down the exact values of each metric involved in profit analysis and their components, either month by month or day by day, for a defined time frame. It’s perfect for understanding where your money is going and identifying opportunities to improve your margins.

Tip: Planning your budget for the next quarter? Use the P&L view to identify key areas where you can reduce costs, such as shipping or advertising, and areas where an increased investment could boost your overall profitability. This holistic approach ensures that every dollar is working as hard as possible for your business.
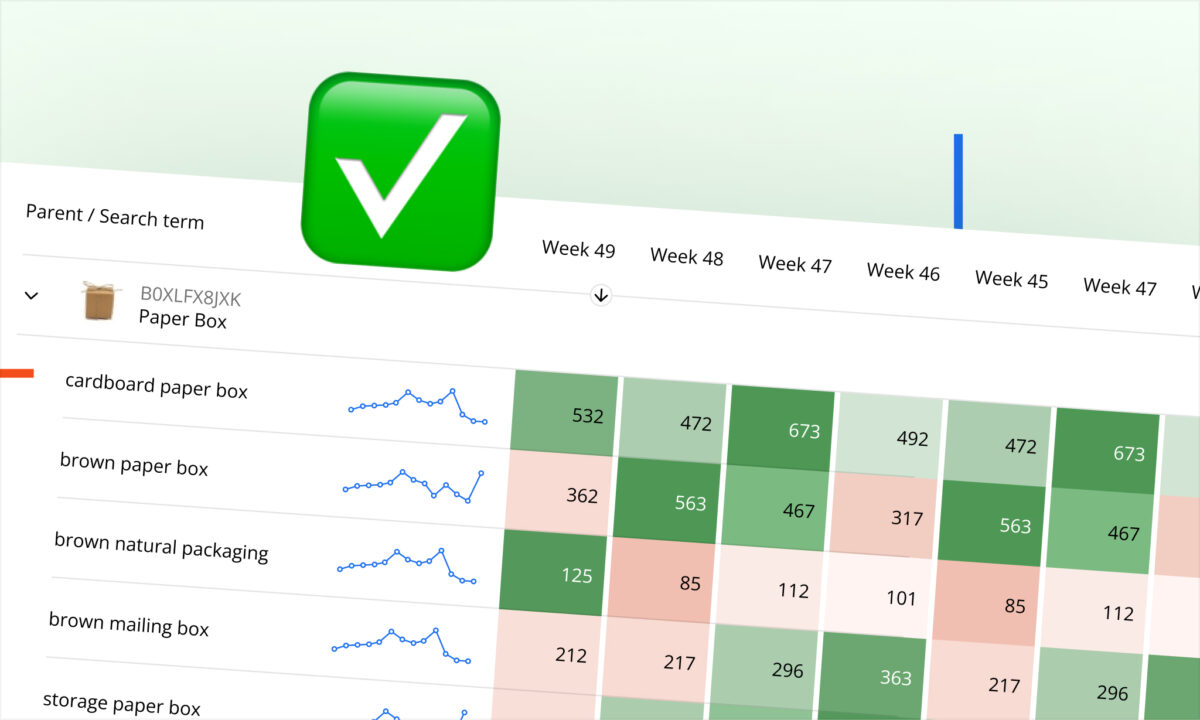
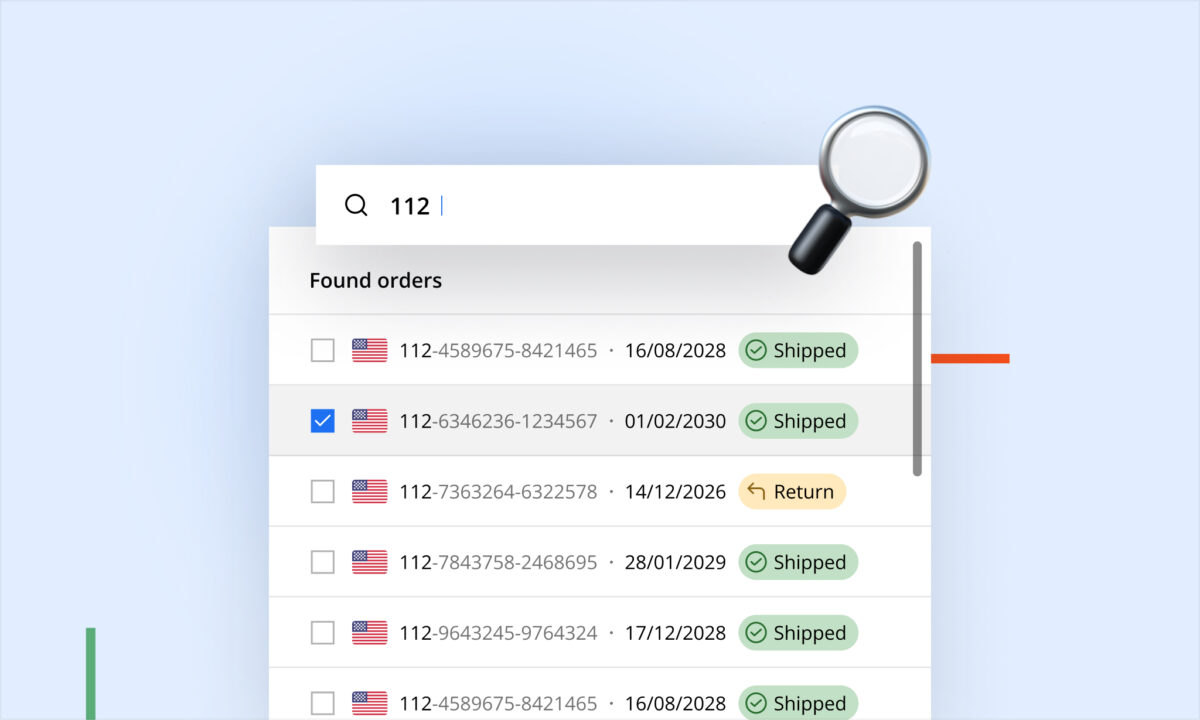
Trends View: Spot and Act on Trends
Did you know that our Trends View feature helps you analyze and compare the evolution of specific metrics at the product level? This view offers filtering options by name, tag, SKU, or ASIN and allows you to compare values month by month or day by day. You can sort products by various metrics and quickly identify the best or least performing products.
Advice: Use Trends View to spot declining sales early on. By identifying which products are underperforming, you can take swift action to investigate and address issues, whether it’s optimizing your listings, adjusting your pricing strategy, or reallocating your advertising budget. Staying ahead of these trends can make a significant difference in your bottom line.
We believe in empowering you with the tools needed to make data-driven decisions. These features are designed to provide you with in-depth insights into your Amazon business, helping you boost your profitability and streamline your operations.
Explore these features today and take your Amazon business to new heights!