Understanding customer behavior is critical for success in today’s competitive e-commerce landscape. While profitability is always top of mind, Customer Lifetime Value (LTV) provides deeper insights into the true worth of your customers. Especially for sellers offering consumable products or items purchased regularly, tracking LTV can be a game-changer.
Let’s explore how sellerboard’s LTV Dashboard helps you leverage this powerful metric.
Why LTV Matters
Imagine you’re selling a product that might not generate profit on the first sale. Over time, however, customers return to make second or even third purchases. Or perhaps your products are often bought in bulk, like a customer purchasing several glasses to complete a kitchen set.
Consumables, like toothpaste or food items, also highlight the importance of recurring sales. Customers who repeatedly purchase these items create significant value throughout their lifecycle. Knowing your LTV allows you to:
- Plan customer acquisition costs effectively.
- Identify products that drive repeat purchases.
- Strategize around bulk sales or bundling opportunities.
Navigating the LTV Dashboard
You can find the LTV Dashboard in your sellerboard account under the Profit tab. It comprises three main sections:
- Account-Level Metrics: Displays accumulated sales per buyer in terms of total sales value, units sold, and orders per buyer.
- Product-Level Metrics: Breaks down the same information for individual products.
- Filters: Allows you to analyze data by product, time period, or marketplace.
What Does the Data Tell You?
Accumulated Sales Per Buyer (Value)
This metric shows how much revenue a single customer has generated over the last 3, 6, 12, or 24 months. Trends in this data can reveal:
- Whether customers are returning for repeat purchases.
- If sales are increasing over time for specific products.
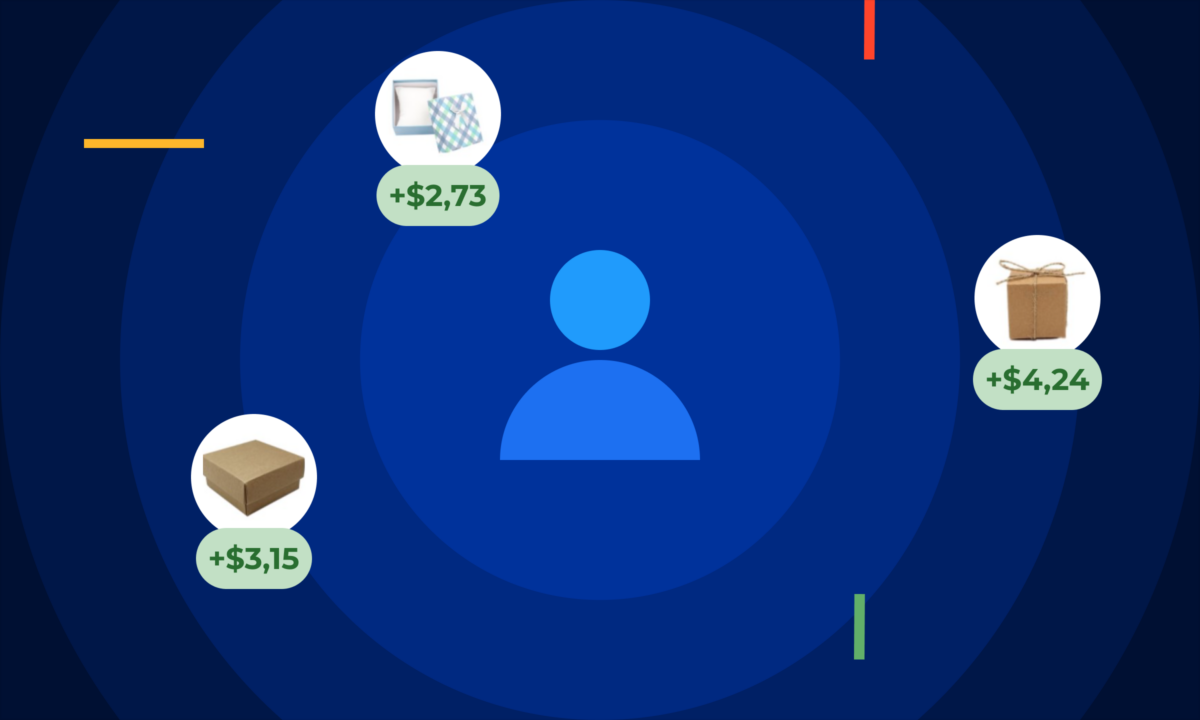
For example, a corrugated box priced at $22.99 shows an LTV of $23.37 over the last three months. This indicates that customers are purchasing this product more than once.
Accumulated Sales Per Buyer (Units)
This shows the average number of units sold per customer over time. For instance, a jewelry box sold 1.61 units per customer on average over three months. This suggests:
- Customers are either buying multiple units in one order or returning to purchase again.
- An upward trend could indicate growing bulk or recurring sales.
Accumulated Orders Per Buyer
This metric reveals the frequency of orders placed by each customer. If the value is low, like 1.01 orders, it’s likely that customers buy multiple items in a single transaction rather than returning for additional orders.
Leveraging LTV Insights
With sellerboard’s LTV Dashboard, you can:
- Identify products ideal for bundling or bulk sales.
- Plan advertising budgets based on products with higher repeat purchase rates.
- Focus on consumables that drive customer retention.
For example, if a product’s accumulated sales per buyer show repeat purchases, you might allocate more to acquire customers for that product, knowing future sales will offset the initial cost.
Conclusion
The LTV Dashboard is a powerful tool for understanding how much value your customers bring to your business over time. Whether it’s planning acquisition costs, discovering bundling opportunities, or analyzing recurring sales, sellerboard’s insights empower you to make data-driven decisions for sustained growth.
Ready to explore your LTV and unlock your business’s potential? Log in to your sellerboard account and check out the LTV Dashboard today!
